

Analyst
Elena Chen
elena.chen@uobkh.comAnalyst
Qi Wang, CFA
qi.wang@uobkh.comAnalyst
In collaboration with UOBKH Institutional Research
Key China Market Indices
Index | Price | Past 2-Week Return | YTD Return |
Hang Seng Index | 24,751 | -3.5% | -3.4% |
HSCEI Index | 8,225 | -3.9% | -7.7% |
Hang Seng Tech Index | 4,406 | -3.6% | -20.1% |
Shanghai Composite Index | 3,912 | -0.5% | -1.4% |
CSI 300 Index | 4,507 | -0.9% | -2.6% |
Source: UOB Kay Hian and iFinD, as of Sep 18, 2026
- Fiscal support advancing, but domestic demand still weak. Aug industrial output rose 5.2% yoy (vs. consensus of 4.8%), while retail sales rose just 0.4% yoy (vs. the 0.8% estimate). In Jan-Aug, fixed-asset investment fell 7.2%, including a 19.9% decline in property investment, while household loans contracted for a second consecutive month, falling by RMB 202.9bn in Aug. Officials called for faster government-bond issuance and use, with disbursements under the RMB800 bn policy-based financing tool starting in September. In all, the macro picture remains mixed: production and exports are cushioning growth, but there is not yet evidence of policy funding lifting project activity or private demand.
- Hong Kong lagged A-shares amid the Fed rate hike and weaker tech. The Hang Seng Index fell 3.5% over the past two weeks, compared with minor declines of 0.5% in Shanghai Composite and 0.9% in CSI 300. Expectations of US policy tightening and Fed rate hikes have added to the valuation pressure in Hong Kong equities. Tech stock performance also diverged between A and H: the onshore STAR50 gained 4.8% while the Hang Seng Tech Index fell 3.6%. Southbound investors bought a net HKD 32.1bn, but the inflow did not prevent a broad Hong Kong sell-off. We remain cautious on Hong Kong, which now sits at the crossfire of weak China macro and rising US rate pressure.
- No sector immune to China’s Growing Pains. Sector leadership offered a relative shelter, but no new rally. Utilities (-0.7%) and Communication Services (-0.8%) led the ranking but still declined in the last two weeks, while Consumer Staples (-6.3%) and Real Estate (-5.9%) recorded the steepest declines. This suggests that no sector is completely immune to China’s Growing Pains, with weakness most acute in consumer and property exposures.
- Tech flows diverged; forward earnings matter more than trailing valuation. Z.AI fell 27.4% despite HKD 6.33bn of Southbound net buying; YOFC rose alongside HKD 1.67bn of net buying; SMIC and MiniMax recorded net selling. In any case, avoid the value trap in China tech stocks: a low trailing P/E look cheap, but it can get cheaper if forward earnings weaken. We suggesting placing greater emphasis on earnings outlook and cash generation than the low P/E alone.
- Best-performing sectors: Utilities -0.7% (e.g. 0836.HK, 0270.HK); Communication Services -0.8% (e.g. 0762.HK, 6823.HK); Industrials -1.8% (e.g. 1308.HK, 0148.HK).
- Potential movers and shakers: Details inside.
Positive | N/A |
Neutral | Anta Sports (2020 HK), Li Ning (2331 HK), Shenzhou International (2313 HK), Trip.com (9961 HK), SHKP (0016.HK), MTR (0066.HK) |
Negative | CATL (300750 CH), Tongcheng Travel (0780 HK), Meituan (3690 HK), Alibaba (9988 HK) |
- Must Watch Events: Chinese’s President’s visit to the US (Sep 23-25), China Jan-Aug industrial profits (Sep 28) and Sep PMIs (Sep 30); Hong Kong Aug merchandise trade (Sep 24) and retail sales (Oct 2). Mainland A-share and Southbound trading will pause for the Mid-Autumn (Sep 25) and National Day holidays (Oct 1-7). Details below.
Date | Macro Data | Sector / Company Events |
Sep 23 | Chinese President’s Visit to the US (till Sep 25) |
|
Sep 24 | Hong Kong Aug external merchandise trade |
|
Sep 25 |
| Mainland A-shares and Southbound Stock Connect closed for the Mid-Autumn Festival |
Sep 28 | China Jan-Aug industrial profits |
|
Sep 30 | China Sep official manufacturing and non-manufacturing PMIs |
|
Oct 1-7 |
| Mainland A-shares and Southbound Stock Connect closed for National Day holidays; |
Oct 2 | Hong Kong Aug retail sales |
|
Best 3 Hang Seng Sectors (Past 2 Weeks)
Hang Seng Sector Index | Past 2-Week Return | YTD Return | Stock Drivers Past 2-Weeks |
Utilities | -0.7% | -1.2% | China Resources Power Holdings Co. Ltd. (0836.HK) +2.8%, Guangdong Investment Limited (0270.HK) +2.8%, CK Infrastructure Holdings Limited (1038.HK) +1.7% |
Communication Services | -0.8% | -7.5% | China Unicom (Hong Kong) Limited (0762.HK) +1.8%, HKT Trust and HKT Ltd. (6823.HK) +1.1%, CITIC Telecom International Holdings Ltd. (1883.HK) 0.0% |
Industrials | -1.8% | 5.4% | SITC International Holdings Company Limited (1308.HK) +6.5%, Kingboard Holdings Limited (0148.HK) +11.0%, Kingboard Laminates Holdings Ltd. (1888.HK) +6.5% |
Source: UOB Kay Hian and iFinD, as of Sep 18, 2026
- Utilities fell 0.7% over two weeks, outperforming the market yet extending its YTD decline to 1.2%. CR Power and Guangdong Investment each gained 2.8%, while CK Infrastructure rose 1.7%. Utilities offered a relative shelter during the recent sell-off, given the sector’s stable and defensive nature.
- Communication Services declined 0.8% over two weeks, extending its YTD decline to 7.5%. China Unicom gained 1.8%, HKT rose 1.1% and CITIC Telecom was flat. These shares held up better than the broader Hong Kong market, despite the sector’s overall negative return.
- Industrials fell 1.8% over two weeks, yet retained a 5.4% YTD gain. SITC rose 6.5%, Kingboard Holdings 11.0% and Kingboard Laminates 6.5%, despite a decline in the sector index. The Kingboard stocks were bright spots given their AI exposure in a weak fortnight for Industrials.
Worst 3 Hang Seng Sectors (Past 2 Weeks)
Hang Seng Sector Index | Past 2-Week Return | YTD Return | Stock Drivers Past 2-Weeks |
Materials | -5.6% | -10.9% | Zijin Mining Group Company Limited (2899.HK) -6.7%, China Hongqiao Group Limited (1378.HK) -5.5%, Zhaojin Mining Industry Company Limited (1818.HK) -8.9% |
Real Estate | -5.9% | -3.4% | Sun Hung Kai Properties Ltd. (0016.HK) -9.9%, KE Holdings Inc. (2423.HK) -10.2%, China Resources Land Ltd. (1109.HK) -5.4% |
Consumer Staples | -6.3% | -18.7% | Nongfu Spring Co., Ltd. (9633.HK) -9.0%, WH Group Limited (0288.HK) -6.3%, Guming Holdings Limited (1364.HK) -12.5% |
Source: UOB Kay Hian and iFinD, as of Sep 18, 2026
- Materials fell 5.6% over two weeks, extending its YTD decline to 10.9%. Zijin Mining lost 6.7%, with China Hongqiao -5.5% and Zhaojin Mining -8.9%. Weakness across gold, copper and aluminum names dragged down the whole sector. The near-term narrative for Materials hinges on whether Chia issues a large enough stimulus rather than on a general reflation theme.
- Real estate declined 5.9% over two weeks, extending its YTD loss to 3.4%. Sun Hung Kai Properties lost 9.9%, KE Holdings 10.2% and China Resources Land 5.4%. Mainland property investment fell 19.9% and new-home sales value declined 13.1% in Jan-Aug, although existing-home transaction area rose 10.6% yoy. This split leaves developers exposed to a weak primary market while providing some offset for KE Holdings’ brokerage business. Sun Hung Kai Properties’ Hong Kong exposure also makes it a separate case. Given China’s Growing Pains, the sector has yet to show a broad-based recovery.
- Consumer staples was the weakest sector, down 6.3% over two weeks and down another 18.7% YTD. Nongfu Spring fell 9.0%, with WH Group -6.3% and Guming -12.5%. August retail sales rose only 0.4% yoy, even as food and beverage sales at larger retailers grew 4.0% and 4.9%, respectively. Consumption was therefore more uneven than the headline retail figure suggests, offering little basis for a broad re-rating of the sector.
Southbound Trading Summary (Past 2 Weeks)
(HKD millions) | Ticker | Total Buy | Total Sell | Net Buy (Sell) | % of Total Turnover | Past 2-Week Return | Data |
Southbound Total | HSHKI.HK | 443,144 | 411,032 | 32,112 | 34% | -3.3% | Full |
Z.AI | 2513.HK | 28,277 | 21,944 | 6,333 | 35% | -27.4% | Full |
YOFC | 6869.HK | 19,137 | 17,464 | 1,672 | 47% | 15.7% | Full |
MINIMAX-W | 0100.HK | 15,180 | 16,559 | (1,379) | 36% | -16.2% | Partial |
TENCENT | 0700.HK | 15,530 | 14,691 | 839 | 22% | -5.4% | Partial |
SMIC | 0981.HK | 12,926 | 14,756 | (1,831) | 43% | -3.1% | Partial |
KB LAMINATES | 1888.HK | 12,469 | 12,170 | 300 | 41% | 6.5% | Partial |
BABA-W | 9988.HK | 7,860 | 8,603 | (743) | 19% | -0.7% | Partial |
CIG | 6166.HK | 7,600 | 7,146 | 454 | 56% | 29.5% | Partial |
CNOOC | 0883.HK | 6,502 | 6,022 | 480 | 51% | -2.3% | Partial |
XIAOMI-W | 1810.HK | 5,235 | 3,282 | 1,954 | 25% | -7.2% | Partial |
Source: UOB Kay Hian and iFinD, as of Sep 18, 2026.
Note: Based on the two-week period from Sep 7 to Sep 18, 2026. For Stock Connect Southbound trading, only the top 10 most actively traded securities are disclosed. “Full data” means the stock appeared on the top 10 list for each of the past few trading days. “Partial data” means otherwise.
- Southbound investors bought into a falling Hong Kong market. Gross turnover reached HKD 854.2bn, with HKD 443.1bn in buys and HKD 411.0bn in sells, resulting in net buying of HKD 32.1bn. The Hang Seng Stock Connect Hong Kong Index nonetheless fell 3.3%. This combination suggests mainland investors were buying on dips, although their purchases did not reverse a broader decline.
- Buying of tech-related names followed different patterns. Z.AI attracted HKD 6.33bn of net buying despite a 27.4% share-price decline, while Xiaomi drew HKD 1.95bn and fell 7.2%. YOFC, by contrast, gained 15.7% alongside HKD 1.67bn of net buying. The flows suggest investors were adding to certain falling names while selectively backing shares with positive momentum.
- Selling elsewhere points to rotation within technology. SMIC, MiniMax and Alibaba recorded HKD 1.83bn, HKD 1.38bn and HKD 0.74bn of net-selling respectively, while Tencent attracted HKD 0.84bn of net buying. This split argues against treating Southbound technology flows as a single trade. For Big Tech stocks in particular, low trailing P/E multiples also offer limited comfort if forward earnings come under pressure.
Stocks: Potential Movers and Shakers
Stock | Sector | Type of Events | Our Take |
CATL (300750 CH) | Consumer Discretionary | Channel Check /Corporate Action | Negative |
- CATL's share price came under renewed pressure over the fortnight amid concerns that auto OEMs were diversifying away from the battery maker. Reports that Li Auto, Xiaomi, Aito and XPeng had broadened their battery-cell sourcing contributed to the decline.
- Since CATL’s listing in 2017, this concern has surfaced repeatedly but has not really materialised. CATL’s installations grew 22.5% yoy to 218.2GWh in 8M2026, boosting its market share by 2.0ppt yoy to 44.7%.
- The switching fear appears groundless. CATL’s technology, reliability and brand remain key competitive advantages. Similar concerns peaked in late 2023 without costing the company any market share, while some OEMs that switched suppliers subsequently reversed course. For example, Geely recalled vehicles over Sunwoda cell defects, while Aion returned to CATL as complaints about CALB batteries mounted.
- Incidentally, CATL cancelled RMB 947m of A shares on 16 Sep 26 under a RMB 20b-40b 12-month mandate, or 1.31-2.61% of capital.
- Maintain BUY on CATL, with 2026-28 net profit of RMB 93.64b/117.64b/141.88b and a target price of RMB 585 for A-share and HK$675 for H-share (23x 2027F PE). CATL is also our Core Recommendation. (Zeng Sheng Di)
Stock | Sector | Type of Events | Our Take |
Anta Sports (2020 HK) Li Ning (2331 HK) Shenzhou International (2313 HK) | Consumer Discretionary | Channel Checks | Neutral |
- Assessing the impacts of El Niño. Against the backdrop of a strong El Niño expected during Sep 2026-Feb 2027, agricultural commodity prices have risen – well ahead of the previous two El Niño cycles. We expect upside pressure on domestic sugar prices to be manageable, supported by comfortable domestic supply conditions and lower reliance on imports. In contrast, palm oil remains the key swing factor within the food cost basket, although any meaningful cost pressure is more likely to emerge in 2027.
- El Niño could result in a warmer winter. El Niño could affect consumer companies through two channels. On the supply side, it may increase input costs and, as a result, create pressure on margins. We see the impact as most relevant for: a) food producers with high exposure to instant noodles, bakery products and snacks; and b) apparel manufacturers and brands. On the demand side, it could affect seasonal consumption trends, particularly by dampening demand for cold-weather products. In particular, a milder winter may dampen demand for cold-weather products, including down jackets and other winter apparel. We therefore prefer companies with a diversified multi-brand portfolio, which can better absorb volatility in seasonal categories, particularly winter-related products. We prefer Anta. (Stella Guo/Ejann Hiew)
Stock | Sector | Type of Events | Our Take |
Tongcheng Travel (0780 HK) Meituan (3690 HK) Alibaba (9988 HK) | Consumer Discretionary | Legal / Regulatory | Negative |
Trip.com (9961 HK) | Consumer Discretionary | Legal / Regulatory | Neutral |
- Latest investigations not a repeat of Trip.com’s antitrust case. Beijing’s market regulator has opened investigations into the operating entities of Fliggy (Alibaba), Tongcheng Travel, Tujia and Meituan under the Anti-Unfair Competition Law and the E-commerce Law. We think this differs from the Anti-Monopoly Law used to impose the RMB 5.18b penalty on Trip.com. As neither the alleged conduct nor the applicable provisions have been disclosed, the eventual penalties remain uncertain, although the direct financial risk is likely to be materially smaller than in Trip.com’s case.
- Earnings exposure matters more than potential fines. Tongcheng Travel has the greatest direct exposure because accommodation bookings are a core source of revenue. Meituan’s hotel business contributes a relatively small share of group revenue but carries higher margins, making the potential profit impact more relevant than the revenue impact. Fliggy’s contribution to Alibaba is limited, while Trip.com holds only a minority stake in Tujia. The main risk is therefore whether the investigation leads to tighter rules governing commissions, pricing, promotions and traffic allocation, particularly for Tongcheng and Meituan.
- Trip.com is relatively better positioned, but not insulated from industry-wide changes. Trip.com was not named in the latest investigations and has already begun adjusting its operations following the earlier antitrust ruling. Scrutiny of competing platforms reduces the risk that rivals can exploit Trip.com’s compliance restrictions to gain share through more aggressive pricing or merchant terms. However, any industry-wide restrictions on commissions or platform monetisation could still constrain its take rate, making this a relative advantage rather than an outright removal of regulatory risk. Trip.com remains our Core Recommendation. (Elena Chen)
Stock | Sector | Type of Events | Our Take |
SHKP (0016.HK) | Real Estate | Legal / Regulatory | Neutral |
- Hong Kong's 2026 Policy Address and first Five-Year Plan. The HKSAR government published both documents on 16 Sep 2026, emphasising policy continuity and consistency. We view the near-term impact on the housing market as neutral. Demand-side support is confined to a narrow pro-fertility measure: a stamp-duty concession of up to HKD 20,000 for eligible buyers who purchase a residential property from one year before to two years after childbirth, where the child is born in Hong Kong on or after 16 Sep 2026 and either parent is a permanent resident. No broad demand-boosting measures were announced, given the relatively strong momentum in the residential market. Medium-term land supply is largely unchanged from 2025, with about 2,500ha of spade-ready sites targeted over 2027-28 to 2036-37 against a 2,600ha target a year ago, and the Kau Yi Chau Artificial Islands project absent from both documents.
- Northern Metropolis land creation is now the only binding economic indicator. The Five-Year Plan commits the government to 900ha of spade-ready sites in the Northern Metropolis (NM) over 2026-27 to 2030-31, the single binding economic indicator among the 22 KPIs in the plan. NM accounts for about 1,000ha, or 71%, of the 1,400ha of spade-ready sites due in the first five years. The planned university town area was tripled to around 300ha of campus land across San Tin, Hung Shui Kiu and Ta Kwu Ling, with Hung Shui Kiu prioritised from 2026. We expect this to reshape the land-banking strategies of the major developers over the next five years.
- Maintain MARKET WEIGHT on the Hong Kong property sector. As the final Policy Address of the current administration's term, it keeps a consistent stance and should be broadly neutral near term. Rising HIBOR, with the one-month rate hitting 3%, and tighter Mainland tax policies are the main risks, although the recent correction has partially priced them in. Our top pick remains SHKP. (Damon Shen)
Type of Events | Explanation |
Channel Checks | Industry-wide or supply chain news with implications to a particular sector or company |
Corporate Action | Dividends, special dividends, stock splits, share buybacks, equity / bond financing, M&As, spin-offs and restructuring etc. |
Earnings | Quarterly earnings for US-listed companies. Semi-annual earnings for Hong Kong-listed companies |
Insider Dealing | Company insiders’ buying / selling of stocks and derivatives of the company |
Investor Action | Lead investor buying / selling including activist investor actions |
Investor Roadshow | Deal and non-deal roadshows, reverse roadshows (analyst days), and company meetings at investment conferences |
Legal / Regulatory | Lawsuits, legislature/regulation changes, other regulatory events |
Macro / Industry Data | Regular economic or industry data related to the sector or stock |
Sales / Products | Sales or product related news, such as monthly sales or new product launches |
Public Event | Public speeches and appearances by companies in the media or industry conferences |
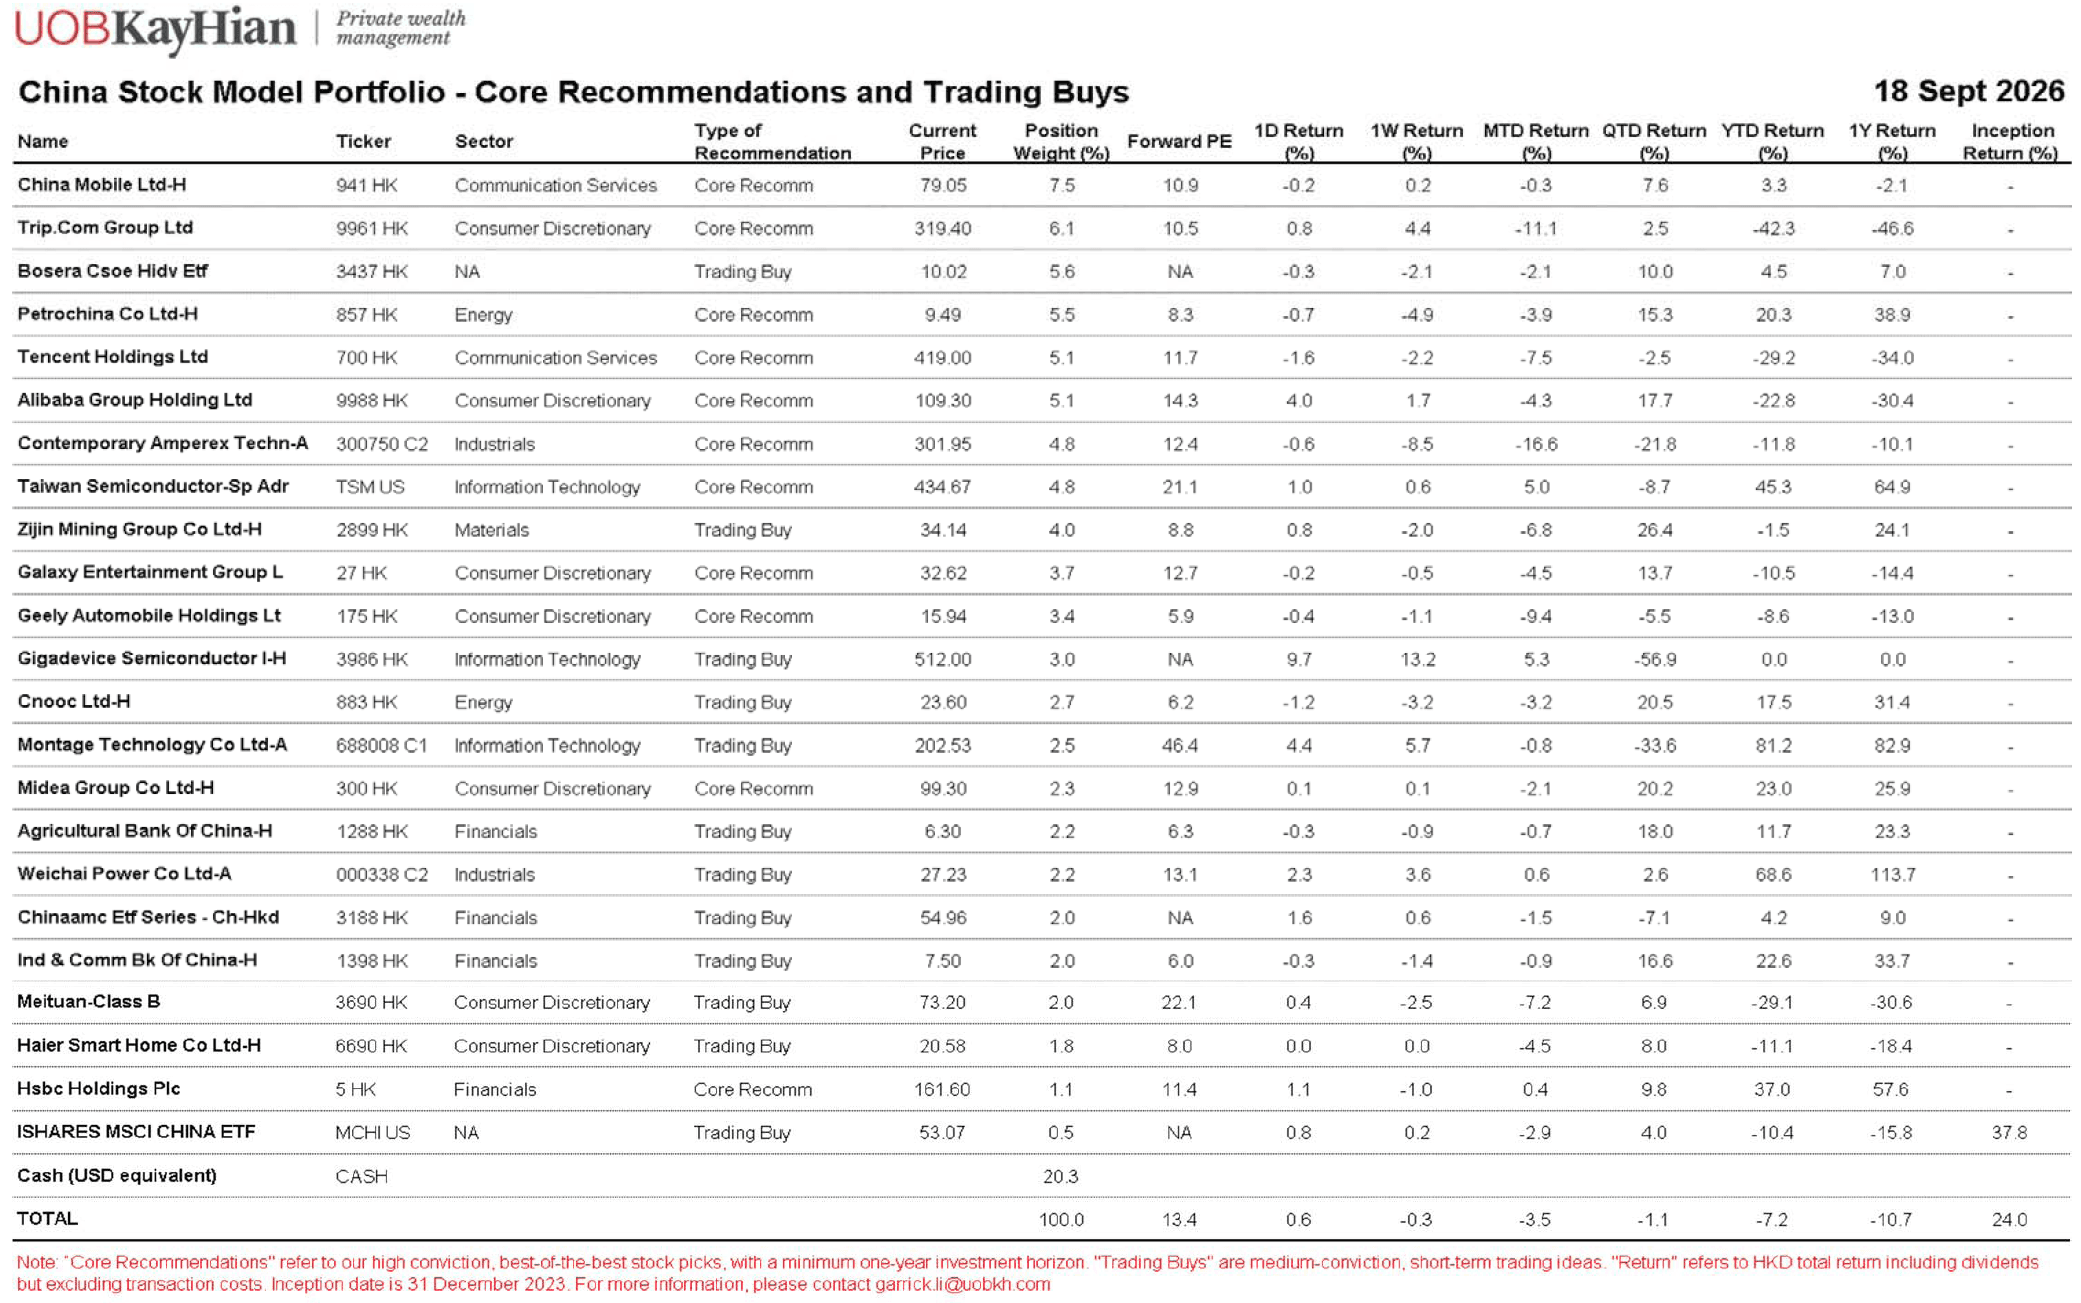
Appendix - China Stock Model Portfolio
Key China Market Indices
Index | Price | Past 2-Week Return | YTD Return |
Hang Seng Index | 24,751 | -3.5% | -3.4% |
HSCEI Index | 8,225 | -3.9% | -7.7% |
Hang Seng Tech Index | 4,406 | -3.6% | -20.1% |
Shanghai Composite Index | 3,912 | -0.5% | -1.4% |
CSI 300 Index | 4,507 | -0.9% | -2.6% |
Source: UOB Kay Hian and iFinD, as of Sep 18, 2026
- Fiscal support advancing, but domestic demand still weak. Aug industrial output rose 5.2% yoy (vs. consensus of 4.8%), while retail sales rose just 0.4% yoy (vs. the 0.8% estimate). In Jan-Aug, fixed-asset investment fell 7.2%, including a 19.9% decline in property investment, while household loans contracted for a second consecutive month, falling by RMB 202.9bn in Aug. Officials called for faster government-bond issuance and use, with disbursements under the RMB800 bn policy-based financing tool starting in September. In all, the macro picture remains mixed: production and exports are cushioning growth, but there is not yet evidence of policy funding lifting project activity or private demand.
- Hong Kong lagged A-shares amid the Fed rate hike and weaker tech. The Hang Seng Index fell 3.5% over the past two weeks, compared with minor declines of 0.5% in Shanghai Composite and 0.9% in CSI 300. Expectations of US policy tightening and Fed rate hikes have added to the valuation pressure in Hong Kong equities. Tech stock performance also diverged between A and H: the onshore STAR50 gained 4.8% while the Hang Seng Tech Index fell 3.6%. Southbound investors bought a net HKD 32.1bn, but the inflow did not prevent a broad Hong Kong sell-off. We remain cautious on Hong Kong, which now sits at the crossfire of weak China macro and rising US rate pressure.
- No sector immune to China’s Growing Pains. Sector leadership offered a relative shelter, but no new rally. Utilities (-0.7%) and Communication Services (-0.8%) led the ranking but still declined in the last two weeks, while Consumer Staples (-6.3%) and Real Estate (-5.9%) recorded the steepest declines. This suggests that no sector is completely immune to China’s Growing Pains, with weakness most acute in consumer and property exposures.
- Tech flows diverged; forward earnings matter more than trailing valuation. Z.AI fell 27.4% despite HKD 6.33bn of Southbound net buying; YOFC rose alongside HKD 1.67bn of net buying; SMIC and MiniMax recorded net selling. In any case, avoid the value trap in China tech stocks: a low trailing P/E look cheap, but it can get cheaper if forward earnings weaken. We suggesting placing greater emphasis on earnings outlook and cash generation than the low P/E alone.
- Best-performing sectors: Utilities -0.7% (e.g. 0836.HK, 0270.HK); Communication Services -0.8% (e.g. 0762.HK, 6823.HK); Industrials -1.8% (e.g. 1308.HK, 0148.HK).
- Potential movers and shakers: Details inside.
Positive | N/A |
Neutral | Anta Sports (2020 HK), Li Ning (2331 HK), Shenzhou International (2313 HK), Trip.com (9961 HK), SHKP (0016.HK), MTR (0066.HK) |
Negative | CATL (300750 CH), Tongcheng Travel (0780 HK), Meituan (3690 HK), Alibaba (9988 HK) |
- Must Watch Events: Chinese’s President’s visit to the US (Sep 23-25), China Jan-Aug industrial profits (Sep 28) and Sep PMIs (Sep 30); Hong Kong Aug merchandise trade (Sep 24) and retail sales (Oct 2). Mainland A-share and Southbound trading will pause for the Mid-Autumn (Sep 25) and National Day holidays (Oct 1-7). Details below.
Date | Macro Data | Sector / Company Events |
Sep 23 | Chinese President’s Visit to the US (till Sep 25) |
|
Sep 24 | Hong Kong Aug external merchandise trade |
|
Sep 25 |
| Mainland A-shares and Southbound Stock Connect closed for the Mid-Autumn Festival |
Sep 28 | China Jan-Aug industrial profits |
|
Sep 30 | China Sep official manufacturing and non-manufacturing PMIs |
|
Oct 1-7 |
| Mainland A-shares and Southbound Stock Connect closed for National Day holidays; |
Oct 2 | Hong Kong Aug retail sales |
|
Best 3 Hang Seng Sectors (Past 2 Weeks)
Hang Seng Sector Index | Past 2-Week Return | YTD Return | Stock Drivers Past 2-Weeks |
Utilities | -0.7% | -1.2% | China Resources Power Holdings Co. Ltd. (0836.HK) +2.8%, Guangdong Investment Limited (0270.HK) +2.8%, CK Infrastructure Holdings Limited (1038.HK) +1.7% |
Communication Services | -0.8% | -7.5% | China Unicom (Hong Kong) Limited (0762.HK) +1.8%, HKT Trust and HKT Ltd. (6823.HK) +1.1%, CITIC Telecom International Holdings Ltd. (1883.HK) 0.0% |
Industrials | -1.8% | 5.4% | SITC International Holdings Company Limited (1308.HK) +6.5%, Kingboard Holdings Limited (0148.HK) +11.0%, Kingboard Laminates Holdings Ltd. (1888.HK) +6.5% |
Source: UOB Kay Hian and iFinD, as of Sep 18, 2026
- Utilities fell 0.7% over two weeks, outperforming the market yet extending its YTD decline to 1.2%. CR Power and Guangdong Investment each gained 2.8%, while CK Infrastructure rose 1.7%. Utilities offered a relative shelter during the recent sell-off, given the sector’s stable and defensive nature.
- Communication Services declined 0.8% over two weeks, extending its YTD decline to 7.5%. China Unicom gained 1.8%, HKT rose 1.1% and CITIC Telecom was flat. These shares held up better than the broader Hong Kong market, despite the sector’s overall negative return.
- Industrials fell 1.8% over two weeks, yet retained a 5.4% YTD gain. SITC rose 6.5%, Kingboard Holdings 11.0% and Kingboard Laminates 6.5%, despite a decline in the sector index. The Kingboard stocks were bright spots given their AI exposure in a weak fortnight for Industrials.
Worst 3 Hang Seng Sectors (Past 2 Weeks)
Hang Seng Sector Index | Past 2-Week Return | YTD Return | Stock Drivers Past 2-Weeks |
Materials | -5.6% | -10.9% | Zijin Mining Group Company Limited (2899.HK) -6.7%, China Hongqiao Group Limited (1378.HK) -5.5%, Zhaojin Mining Industry Company Limited (1818.HK) -8.9% |
Real Estate | -5.9% | -3.4% | Sun Hung Kai Properties Ltd. (0016.HK) -9.9%, KE Holdings Inc. (2423.HK) -10.2%, China Resources Land Ltd. (1109.HK) -5.4% |
Consumer Staples | -6.3% | -18.7% | Nongfu Spring Co., Ltd. (9633.HK) -9.0%, WH Group Limited (0288.HK) -6.3%, Guming Holdings Limited (1364.HK) -12.5% |
Source: UOB Kay Hian and iFinD, as of Sep 18, 2026
- Materials fell 5.6% over two weeks, extending its YTD decline to 10.9%. Zijin Mining lost 6.7%, with China Hongqiao -5.5% and Zhaojin Mining -8.9%. Weakness across gold, copper and aluminum names dragged down the whole sector. The near-term narrative for Materials hinges on whether Chia issues a large enough stimulus rather than on a general reflation theme.
- Real estate declined 5.9% over two weeks, extending its YTD loss to 3.4%. Sun Hung Kai Properties lost 9.9%, KE Holdings 10.2% and China Resources Land 5.4%. Mainland property investment fell 19.9% and new-home sales value declined 13.1% in Jan-Aug, although existing-home transaction area rose 10.6% yoy. This split leaves developers exposed to a weak primary market while providing some offset for KE Holdings’ brokerage business. Sun Hung Kai Properties’ Hong Kong exposure also makes it a separate case. Given China’s Growing Pains, the sector has yet to show a broad-based recovery.
- Consumer staples was the weakest sector, down 6.3% over two weeks and down another 18.7% YTD. Nongfu Spring fell 9.0%, with WH Group -6.3% and Guming -12.5%. August retail sales rose only 0.4% yoy, even as food and beverage sales at larger retailers grew 4.0% and 4.9%, respectively. Consumption was therefore more uneven than the headline retail figure suggests, offering little basis for a broad re-rating of the sector.
Southbound Trading Summary (Past 2 Weeks)
(HKD millions) | Ticker | Total Buy | Total Sell | Net Buy (Sell) | % of Total Turnover | Past 2-Week Return | Data |
Southbound Total | HSHKI.HK | 443,144 | 411,032 | 32,112 | 34% | -3.3% | Full |
Z.AI | 2513.HK | 28,277 | 21,944 | 6,333 | 35% | -27.4% | Full |
YOFC | 6869.HK | 19,137 | 17,464 | 1,672 | 47% | 15.7% | Full |
MINIMAX-W | 0100.HK | 15,180 | 16,559 | (1,379) | 36% | -16.2% | Partial |
TENCENT | 0700.HK | 15,530 | 14,691 | 839 | 22% | -5.4% | Partial |
SMIC | 0981.HK | 12,926 | 14,756 | (1,831) | 43% | -3.1% | Partial |
KB LAMINATES | 1888.HK | 12,469 | 12,170 | 300 | 41% | 6.5% | Partial |
BABA-W | 9988.HK | 7,860 | 8,603 | (743) | 19% | -0.7% | Partial |
CIG | 6166.HK | 7,600 | 7,146 | 454 | 56% | 29.5% | Partial |
CNOOC | 0883.HK | 6,502 | 6,022 | 480 | 51% | -2.3% | Partial |
XIAOMI-W | 1810.HK | 5,235 | 3,282 | 1,954 | 25% | -7.2% | Partial |
Source: UOB Kay Hian and iFinD, as of Sep 18, 2026.
Note: Based on the two-week period from Sep 7 to Sep 18, 2026. For Stock Connect Southbound trading, only the top 10 most actively traded securities are disclosed. “Full data” means the stock appeared on the top 10 list for each of the past few trading days. “Partial data” means otherwise.
- Southbound investors bought into a falling Hong Kong market. Gross turnover reached HKD 854.2bn, with HKD 443.1bn in buys and HKD 411.0bn in sells, resulting in net buying of HKD 32.1bn. The Hang Seng Stock Connect Hong Kong Index nonetheless fell 3.3%. This combination suggests mainland investors were buying on dips, although their purchases did not reverse a broader decline.
- Buying of tech-related names followed different patterns. Z.AI attracted HKD 6.33bn of net buying despite a 27.4% share-price decline, while Xiaomi drew HKD 1.95bn and fell 7.2%. YOFC, by contrast, gained 15.7% alongside HKD 1.67bn of net buying. The flows suggest investors were adding to certain falling names while selectively backing shares with positive momentum.
- Selling elsewhere points to rotation within technology. SMIC, MiniMax and Alibaba recorded HKD 1.83bn, HKD 1.38bn and HKD 0.74bn of net-selling respectively, while Tencent attracted HKD 0.84bn of net buying. This split argues against treating Southbound technology flows as a single trade. For Big Tech stocks in particular, low trailing P/E multiples also offer limited comfort if forward earnings come under pressure.
Stocks: Potential Movers and Shakers
Stock | Sector | Type of Events | Our Take |
CATL (300750 CH) | Consumer Discretionary | Channel Check /Corporate Action | Negative |
- CATL's share price came under renewed pressure over the fortnight amid concerns that auto OEMs were diversifying away from the battery maker. Reports that Li Auto, Xiaomi, Aito and XPeng had broadened their battery-cell sourcing contributed to the decline.
- Since CATL’s listing in 2017, this concern has surfaced repeatedly but has not really materialised. CATL’s installations grew 22.5% yoy to 218.2GWh in 8M2026, boosting its market share by 2.0ppt yoy to 44.7%.
- The switching fear appears groundless. CATL’s technology, reliability and brand remain key competitive advantages. Similar concerns peaked in late 2023 without costing the company any market share, while some OEMs that switched suppliers subsequently reversed course. For example, Geely recalled vehicles over Sunwoda cell defects, while Aion returned to CATL as complaints about CALB batteries mounted.
- Incidentally, CATL cancelled RMB 947m of A shares on 16 Sep 26 under a RMB 20b-40b 12-month mandate, or 1.31-2.61% of capital.
- Maintain BUY on CATL, with 2026-28 net profit of RMB 93.64b/117.64b/141.88b and a target price of RMB 585 for A-share and HK$675 for H-share (23x 2027F PE). CATL is also our Core Recommendation. (Zeng Sheng Di)
Stock | Sector | Type of Events | Our Take |
Anta Sports (2020 HK) Li Ning (2331 HK) Shenzhou International (2313 HK) | Consumer Discretionary | Channel Checks | Neutral |
- Assessing the impacts of El Niño. Against the backdrop of a strong El Niño expected during Sep 2026-Feb 2027, agricultural commodity prices have risen – well ahead of the previous two El Niño cycles. We expect upside pressure on domestic sugar prices to be manageable, supported by comfortable domestic supply conditions and lower reliance on imports. In contrast, palm oil remains the key swing factor within the food cost basket, although any meaningful cost pressure is more likely to emerge in 2027.
- El Niño could result in a warmer winter. El Niño could affect consumer companies through two channels. On the supply side, it may increase input costs and, as a result, create pressure on margins. We see the impact as most relevant for: a) food producers with high exposure to instant noodles, bakery products and snacks; and b) apparel manufacturers and brands. On the demand side, it could affect seasonal consumption trends, particularly by dampening demand for cold-weather products. In particular, a milder winter may dampen demand for cold-weather products, including down jackets and other winter apparel. We therefore prefer companies with a diversified multi-brand portfolio, which can better absorb volatility in seasonal categories, particularly winter-related products. We prefer Anta. (Stella Guo/Ejann Hiew)
Stock | Sector | Type of Events | Our Take |
Tongcheng Travel (0780 HK) Meituan (3690 HK) Alibaba (9988 HK) | Consumer Discretionary | Legal / Regulatory | Negative |
Trip.com (9961 HK) | Consumer Discretionary | Legal / Regulatory | Neutral |
- Latest investigations not a repeat of Trip.com’s antitrust case. Beijing’s market regulator has opened investigations into the operating entities of Fliggy (Alibaba), Tongcheng Travel, Tujia and Meituan under the Anti-Unfair Competition Law and the E-commerce Law. We think this differs from the Anti-Monopoly Law used to impose the RMB 5.18b penalty on Trip.com. As neither the alleged conduct nor the applicable provisions have been disclosed, the eventual penalties remain uncertain, although the direct financial risk is likely to be materially smaller than in Trip.com’s case.
- Earnings exposure matters more than potential fines. Tongcheng Travel has the greatest direct exposure because accommodation bookings are a core source of revenue. Meituan’s hotel business contributes a relatively small share of group revenue but carries higher margins, making the potential profit impact more relevant than the revenue impact. Fliggy’s contribution to Alibaba is limited, while Trip.com holds only a minority stake in Tujia. The main risk is therefore whether the investigation leads to tighter rules governing commissions, pricing, promotions and traffic allocation, particularly for Tongcheng and Meituan.
- Trip.com is relatively better positioned, but not insulated from industry-wide changes. Trip.com was not named in the latest investigations and has already begun adjusting its operations following the earlier antitrust ruling. Scrutiny of competing platforms reduces the risk that rivals can exploit Trip.com’s compliance restrictions to gain share through more aggressive pricing or merchant terms. However, any industry-wide restrictions on commissions or platform monetisation could still constrain its take rate, making this a relative advantage rather than an outright removal of regulatory risk. Trip.com remains our Core Recommendation. (Elena Chen)
Stock | Sector | Type of Events | Our Take |
SHKP (0016.HK) | Real Estate | Legal / Regulatory | Neutral |
- Hong Kong's 2026 Policy Address and first Five-Year Plan. The HKSAR government published both documents on 16 Sep 2026, emphasising policy continuity and consistency. We view the near-term impact on the housing market as neutral. Demand-side support is confined to a narrow pro-fertility measure: a stamp-duty concession of up to HKD 20,000 for eligible buyers who purchase a residential property from one year before to two years after childbirth, where the child is born in Hong Kong on or after 16 Sep 2026 and either parent is a permanent resident. No broad demand-boosting measures were announced, given the relatively strong momentum in the residential market. Medium-term land supply is largely unchanged from 2025, with about 2,500ha of spade-ready sites targeted over 2027-28 to 2036-37 against a 2,600ha target a year ago, and the Kau Yi Chau Artificial Islands project absent from both documents.
- Northern Metropolis land creation is now the only binding economic indicator. The Five-Year Plan commits the government to 900ha of spade-ready sites in the Northern Metropolis (NM) over 2026-27 to 2030-31, the single binding economic indicator among the 22 KPIs in the plan. NM accounts for about 1,000ha, or 71%, of the 1,400ha of spade-ready sites due in the first five years. The planned university town area was tripled to around 300ha of campus land across San Tin, Hung Shui Kiu and Ta Kwu Ling, with Hung Shui Kiu prioritised from 2026. We expect this to reshape the land-banking strategies of the major developers over the next five years.
- Maintain MARKET WEIGHT on the Hong Kong property sector. As the final Policy Address of the current administration's term, it keeps a consistent stance and should be broadly neutral near term. Rising HIBOR, with the one-month rate hitting 3%, and tighter Mainland tax policies are the main risks, although the recent correction has partially priced them in. Our top pick remains SHKP. (Damon Shen)
Type of Events | Explanation |
Channel Checks | Industry-wide or supply chain news with implications to a particular sector or company |
Corporate Action | Dividends, special dividends, stock splits, share buybacks, equity / bond financing, M&As, spin-offs and restructuring etc. |
Earnings | Quarterly earnings for US-listed companies. Semi-annual earnings for Hong Kong-listed companies |
Insider Dealing | Company insiders’ buying / selling of stocks and derivatives of the company |
Investor Action | Lead investor buying / selling including activist investor actions |
Investor Roadshow | Deal and non-deal roadshows, reverse roadshows (analyst days), and company meetings at investment conferences |
Legal / Regulatory | Lawsuits, legislature/regulation changes, other regulatory events |
Macro / Industry Data | Regular economic or industry data related to the sector or stock |
Sales / Products | Sales or product related news, such as monthly sales or new product launches |
Public Event | Public speeches and appearances by companies in the media or industry conferences |
Appendix - China Stock Model Portfolio
Analyst
Elena Chen
elena.chen@uobkh.comAnalyst
Qi Wang, CFA
qi.wang@uobkh.comAnalyst
In collaboration with UOBKH Institutional Research
Disclosures and disclaimers
This report is provided subject to, and must be read together with, the full Disclosures / Disclaimers available at this link, which are incorporated by reference into this report. In particular, this report is intended for general circulation and informational purposes only and does not constitute personal investment advice or a recommendation to buy or sell any investment product or security. You should independently evaluate the information and, where necessary, seek advice from a qualified financial adviser regarding the suitability of any investment. Analyst certifications required under applicable regulations, including SEC Regulation AC (where relevant), are included in this report. By accessing, receiving or using this report, you acknowledge that you have read, understood and agreed to be bound by the Disclosures / Disclaimers, as may be amended, supplemented or updated from time to time.


