

Analyst
Qi Wang, CFA
qi.wang@uobkh.comAnalyst
Wendy Chen
wendy.chen@uobkh.comAnalyst
Benjamin Tan
benjamintan@uobkh.comFOR PROFESSIONAL INVESTORS OR ACCREDITED INVESTORS OR RELEVANT PERSON (CKA) ONLY
CIO Summary
- Fed Wildcard in full play. September’s sharp repricing of Fed expectations reinforces our Fed Wildcard view, with continued policy uncertainty and wild swings in rate expectations. The diesel price spike adds to the risk of sticky inflation and a hawkish Fed, warranting close monitoring.
- AI financing contributing to surging 10-year Treasury yields? Yes, we think so. We see at least four forces pushing long-term yields higher, including crowding out from AI debt issuance.
- Reiterating our June view: higher for longer. All four forces are unlikely to reverse in the near term, keeping long-term yields higher for longer. We reiterate our June view that 4.5% represents the new floor for 10-year yields while the top of the range remains difficult to gauge.
- Europe: the next pressure point? Surging sovereign yields and mounting fiscal strains, particularly in France, reinforce our higher-for-longer view outside the US. Stress could worsen before policymakers respond, but it is too early to call another euro debt crisis.
- Call to Action. We maintain our Core Recommendation on short-duration (< 3 years), top-rated (A and above), investment-grade bonds. We suggest investors avoid aggressively adding duration until a clearer trading range for long-term yields is established.
- Bond highlight: META 4.8% 15 May 2030
Bond Radar
Below is a list of popular investment-grade (IG) bonds curated by our Products Team. These are for reference only and do not constitute our recommendations. For further details, please contact our fixed-income & credit specialist, Benjamin Tan Shun Chao at benjamintan@uobkh.com.
Asia Non-Financial Corporates
Company | Bond Name | ISIN | Current Price (Oct 12) | YTM (%) | Duration (y) | 6M Performance (%) |
Abu Dhabi | TAQAUH 4.375% | XS2600246552 | USD 97.43 | 5.59 | 2.11 | -2.07 |
Abu Dhabi’s government-owned energy and water conglomerate with the world’s largest single-site solar power plant and other renewables. | ||||||
Singtel | STSP 2.375% | XS2046591413 | USD 92.78 | 5.11 | 2.71 | -1.58 |
State-owned telecom. Largest in Singapore, second in Australia (Optus) and India (Bharti Airtel). Invests in 5G, cloud, and cybersecurity. | ||||||
Petronas | PETMK 3.50% 21 Apr 2030 | USY68856AT38 | USD 93.79 | 5.46 | 3.19 | -3.22 |
Malaysia’s fully government-owned national oil company, operating across the entire oil and gas value chain with strong state support, robust cash generation, and a globally diversified asset base. | ||||||
TSMC | TAISEM 4.125% | US872898AG66 | USD 97.73 | 5.09 | 2.32 | -1.90 |
Top semiconductor manufacturer with leading technologies like the first commercial extreme-ultraviolet lithography (EUV). | ||||||
Alibaba | BABA 4.875% | USG01719AK24 | USD 98.23 | 5.42 | 3.21 | -3.70 |
China’s largest e-commerce company with around 50% market share and a growing user base. Leading cloud provider in Asia Pacific. | ||||||
CNPC Global | CNPCCH 2% | XS2179918037 | USD 89.42 | 5.19 | 3.46 | -2.58 |
| China's government-owned largest oil and gas producer and supplier. One of the world's major oilfield service providers and a globally reputed contractor in engineering construction. | |||||
CNOOC FINANCE | CNOOC 2.875% | US12625GAF19 | USD 93.77 | 5.17 | 2.78 | -1.92 |
| China's state-owned and largest producer of offshore crude oil and natural gas. Known for its pioneering deepwater drilling capabilities. | |||||
Meituan
| MEITUA 4.625% 2 Oct 2029 | USG59669AF11 | USD 97.25 | 5.64 | 2.73 | -2.25 |
| Leading Chinese e-commerce platform for local services, offering a wide range of services such as food delivery, travel booking, and entertainment through its app. | |||||
JD.com
| JD 3.375% 14 Jan 2030 | US47215PAE60 | USD 94.31 | 5.30 | 3.00 | -2.59 |
One of China’s largest e-commerce platforms, focusing on high-quality, branded products, and in-house logistics, making it the leader in categories like electronics and home appliances. | ||||||
Xiaomi
| XIAOMI 3.375% 29 Apr 2030 | USY77108AA93 | USD 93.07 | 5.56 | 3.22 | -2.78 |
| Leading Chinese technology company that designs smartphones, smart devices, and IoT products, recently expanding into electric vehicles | |||||
SK Hynix
| HYUELE 4.375% 9 Nov 2030 | USY8085FBZ28 | USD 95.66 | 5.63 | 3.52 | -3.83 |
| SK Hynix is the world’s second-largest memory chipmaker and a key beneficiary of the global AI-driven demand for high-bandwidth memory. | |||||
Singapore Airlines
| SIASP 3.5% | SGXF10397887 | SGD 103.16 | 2.69 | 3.79 | -1.92 |
| Temasek-controlled, Singapore’s flag carrier with a young fleet and robust liquidity, benefitting from quasi-sovereign support. Operating a full-service carrier (SIA) and low-cost carrier (Scoot) across 130-plus destinations. | |||||
MPACT Treasury
| MCTSP 4.25% 29 Mar 2030 | SGXF59943971 | SGD 105.07 | 2.70 | 3.21 | -2.27 |
| Temasek-backed REIT, owning flagship VivoCity and diversified Grade-A assets across Singapore, Hong Kong and North Asia, providing resilient distributions with organic growth upside. | |||||
Starhub
| STHSP 2.48% 08 Jan 2031 | SGXF30667780 | SGD 98.64 | 2.82 | 3.97 | -1.49 |
| Integrated Singapore telco spanning mobile, broadband, pay-TV and enterprise-ICT services, leveraging 5G and digital platforms to stabilise cash flows and reignite growth. Majority-owned by ST Telemedia, a wholly owned Temasek portfolio company. | |||||
Source: Bloomberg. All prices and yields are indicative and for reference only. Please contact the UOB Kay Hian product team for more information.
US & Europe Non-Financials Corporates
Company | Bond Name | ISIN | Current Price (Oct 12) | YTM (%) | Duration (y) | 6M Performance (%) |
Microsoft | MSFT 1.35% | USU59340AK20 | USD 87.32 | 4.95 | 3.73 | -2.37 |
Big Tech leader with businesses in operating system, search engine, cloud computing, and artificial intelligence etc. A combination of stable cash flows and new growth opportunities. | ||||||
Meta | META 4.8% | US30303M8M79 | USD 98.29 | 5.33 | 3.19 | -3.57 |
Previously Facebook, the origin of today's social media trend. With a growing user base of nearly 4 billion (half of the world population). | ||||||
Nvidia
| NVDA 2.85% 01 Apr 2030 | US67066GAF19 | USD 92.12 | 5.37 | 3.23 | -3.11 |
A prominent chipmaker that designs graphics processing units (GPUs) for gaming and artificial intelligence. It held a dominant position in the graphics cards industry with an 80.2% market share in 2Q23. | ||||||
Costco | COST 1.6% | US22160KAP03 | USD 88.68 | 5.16 | 3.31 | -2.37 |
World's 3rd largest retailer which operates a chain of membership-only big-box warehouse club retail stores. | ||||||
Procter & Gamble | PG 4.35% | US742718GF07 | USD 98.73 | 4.94 | 2.14 | -2.40 |
Founded more than 180 years ago with operations in over 70 countries. Specialize in a wide range of personal health/consumer health, personal care, and hygiene products. | ||||||
Nestle | NESNVX 4.65% | USU6408XAK55 | USD 98.82 | 5.17 | 2.24 | -2.44 |
World's largest food and beverage company with over 2,000 brands and a presence in 188 countries. | ||||||
Pepsico | PEP 4.1% | US713448GL64 | USD 98.02 | 5.04 | 2.10 | -2.10 |
Second-largest food and beverage business in the world based on net revenue, profit, and market capitalization. | ||||||
Coca-Cola Co | KO 2.125% | US191216CM09 | USD 92.18 | 5.06 | 2.75 | -1.96 |
Distributes the world's best-selling soft drink in over 200 countries, outselling its nearest competitor Pepsi by a significant margin. | ||||||
Pfizer | PFE 3.45% | US717081ET61 | USD 96.3 | 5.09 | 2.28 | -2.10 |
Founded in the mid-19th century, American drug maker with a strong and diversified drug portfolio. Biggest pharmaceutical company in the world based on the 2022 revenue. | ||||||
BP Capital America | BPLN 3.723% | US05565QDH83 | USD 97.27 | 5.09 | 1.98 | -1.63 |
Key player in the oil and gas industry that operates in 70 countries. It produces 2.3 million barrels of oil equivalent per day in 2022. | ||||||
McDonald's Corp | MCD 4.8% | US58013MFU36 | USD 99.58 | 5.04 | 1.72 | -1.68 |
The biggest fast-food chain in the world operating in the US and internationally with over 40,000 restaurants worldwide. | ||||||
Walt Disney | DIS 7.625% | USU25497AU95 | USD 105.4 | 4.92 | 1.91 | -2.61 |
Founded in 1923, a leading entertainment and production company known for its iconic animated film theme parks, streaming services, and media networks, creating magical experiences for audiences worldwide. | ||||||
JOHNSON & JOHNSON | JNJ 4.9% | US478160CV47 | USD 98.92 | 5.16 | 4.02 | -4.52 |
Johnson & Johnson manufactures health care products and provides related services for the consumer, pharmaceutical, and medical devices and diagnostics markets. The Company sells products such as skin and hair care products, acetaminophen products, pharmaceuticals, diagnostic equipment, and surgical equipment in countries located around the world. | ||||||
Source: Bloomberg. All prices and yields are indicative and for reference only. Please contact the UOB Kay Hian product team for more information.
Global Financial Institutions
Company | Bond Name | ISIN | Current Price (Oct 12) | YTM (%) | Duration (y) | 6M Performance (%) |
JP Morgan | JPM 4.005% | US46647PAR73 | USD 100.68 | 4.75 | 2.73 | -1.92 |
a) Largest bank in the world by market cap b) CET1 (Common equity Tier 1) ratio at 14.3% in 1Q26. Down 0.2% from 4Q25. Attention: c) Senior Unsecured bond, with respect to the exercise of US bail-in power. d) Resettable features. | ||||||
Bank of America
| BAC 2.087% | US06051GJZ37 | USD 98.14 | 4.75 | 2.39 | -1.36 |
a) The 2nd largest bank, globally, majoring in commercial banking, wealth management and investment banking b) CET1 ratio at 11.2% in 1Q26. Down 0.2% from 4Q25. Attention: c) Senior Unsecured bond, with respect to the exercise of US bail-in power. d) Resettable features. | ||||||
UBS AG | UBS 5.428% | USH42097EV54 | USD 99.72 | 5.55 | 2.13 | -2.56 |
a) One of the most well-established and influential banks globally. Foremost bank in Switzerland, focusing on wealth management, asset management and investment banking. b) CET1 ratio at 14.7% in 1Q26. Up 0.3% from 4Q25. Attention: c) Senior Unsecured bond, with respect to the exercise of Swiss bail-in power. d) Resettable features. | ||||||
HSBC Holdings | HSBC 4.583% | US404280BT50 | USD 101.33 | 4.85 | 3.04 | -1.88 |
a) Bank giant with unique historical and business links to East Asia and a highly multinational footprint b) CET1 ratio at 14.0% in 1Q26. Down 0.9% from 4Q25. Attention: c) Senior Unsecured bond, with respect to the exercise of UK bail-in power. d) Resettable features. | ||||||
BNP Paribas | BNP 5.27% | FR001400JF24 | USD 101.23 | 4.88 | 3.04 | -1.61 |
a) Flagship bank in France, 2nd largest bank in Europe by asset. b) CET1 ratio at 12.8% in 1Q26. Up 0.2% from 4Q25. Attention: c) Senior Preferred bond, with respect to the exercise of France bail-in power. d) Resettable features. | ||||||
Standard Chartered
| STANLN 4.299% 13 Jan 2030 | XS3258535908 | USD 97.29 | 5.60 | 2.08 | -1.88 |
a) Prominent international banking group with a strong presence across Asia, Africa, and the Middle East. b) CET1 ratio at 13.4% in 1Q26. Down 0.7% from 4Q25. Attention: c) Senior Unsecured bond, with respect to the exercise of UK bail-in power. d) Resettable features | ||||||
National Australia Bank | NAB 4.308% 13 Jun 2028 | US632525CJ86 | AUD 98.42 | 5.07 | 3.31 | -0.37 |
a) Australia’s largest business bank (“Big Four”) b) CET1 ratio at 11.48% in 1Q26. Down 0.22% from 4Q25. Attention: c) Senior Unsecured bond | ||||||
FWD Group Holdings
| FWDGHD 7.784% 6 Dec 2033 | XS2730013104 | USD 108.02 | 6.37 | 5.37 | -6.02 |
Hong Kong–headquartered life insurer operating across 10 Asian markets, including Hong Kong, Singapore, Japan, Thailand, Indonesia, and the Philippines, serving over 34 million customers with diversified life, health, and general insurance products. | ||||||
Westpac Banking Corporation
| WSTP 5.151% 12 Feb 2031 | AU3CB0331148 | AUD 100.21 | 5.09 | 3.96 | n.a. |
a) Headquartered in Sydney and Australia’s oldest bank (“Big Four”) b) CET 1 ratio at 12.42% in 1H26. Up 0.18% yoy. Attention: c) Senior Unsecured bond | ||||||
Source: Bloomberg. All prices and yields are indicative and for reference only. Please contact the UOB Kay Hian product team for more information.
We also offer regular updates on selected bonds from the Bond Radar above. The month’s Bond Highlight is on:
META 4.8% 15 May 2030
About the Issuer
Meta Platforms (META) is a global technology leader operating Facebook, Instagram, WhatsApp and Messenger, with a dominant digital advertising business and significant investments in artificial intelligence (AI). As of October 9, 2026, META has an equity market capitalization of approximately USD 1.83tn. As of June 2026, the company held USD 90.26bn in cash, cash equivalents and marketable securities against USD 84bn in outstanding long-term debt, maintaining a modest net cash position despite its aggressive AI investment cycle. The company has USD 84bn of bonds outstanding, with an average maturity of 18.62 years and an average fixed coupon of 5.19% (Bloomberg).
Investment Thesis
- Dominant advertising franchise supports strong cash generation. Meta's advertising business remains its key credit strength, supported by approximately 3.60bn daily active users across its platforms. Revenue grew 28% yoy to USD 60.80bn in 2Q2026, driven by higher advertising impressions and pricing. Its established advertising ecosystem and ability to monetize user engagement provide a strong foundation for debt servicing.
- AI investments strengthen long-term competitiveness. Meta is integrating AI across advertising, content recommendations and consumer applications to improve user engagement and monetization. Management expects 2026 capital expenditure (capex) of USD 130–145bn, including finance lease principal payments, to support AI infrastructure and its core business. While the spending is substantial, successful AI adoption could strengthen advertising efficiency and create additional revenue opportunities over time.
- Heavy capex is increasingly weighing on free cash flow. Capex reached USD 31.08bn in 2Q2026, compared with USD 17.01bn a year earlier. Consequently, free cash flow (FCF) declined approximately 91% yoy to just USD 784mn, despite operating cash flow rising to USD 31.86bn. The sharp deterioration highlights the financial burden of AI infrastructure expansion and raises questions over the sustainability of spending at current levels.
- Strong balance sheet provides a buffer, but AI returns remain the key risk. Meta issued USD 25bn of senior unsecured bonds in May 2026, bringing total outstanding debt principal to USD 84bn. Nevertheless, its substantial liquidity and strong operating cash generation continue to support its credit profile. The main risks are prolonged negative or weak FCF, further debt-funded capex, uncertain returns on AI investments and potential regulatory or litigation-related costs. A sustained deterioration in these areas could gradually weaken its credit metrics.
Financial Highlights (2Q2026)
- Operating cash flow to interest expense: 40.69x. Strong operating cash generation provides substantial coverage of interest obligations, indicating comfortable debt-servicing capacity despite higher borrowing costs.
- Free cash flow (FCF) to total debt: 0.94%. The low quarterly ratio reflects the significant impact of AI infrastructure spending on cash flow. While FCF remains positive, continued heavy capex could weaken internal funding capacity and increase reliance on external financing.
- Net debt / EBITDA: -0.06x (Net cash). Meta maintains a modest net cash position of USD 6.60bn, supported by substantial liquidity and strong earnings. While leverage remains manageable, sustained AI spending and further debt issuance could gradually weaken its balance sheet.
- Current ratio: 2.23x. Current assets remain comfortably above current liabilities, indicating healthy near-term liquidity and sufficient resources to meet short-term obligations.
- Operating margin: 31%. Although profitability remains healthy, the margin declined from 43% a year earlier, reflecting higher operating expenses, including AI-related spending, litigation charges and restructuring costs. Sustaining profitability while scaling AI investments will be important for Meta's longer-term credit strength.
Macro Comments
We track the following US economic data to understand the Fed policy and interest rate changes. We then selectively comment on a few of the indicators, those that we deem the most relevant.
Inflation | Consumption | Production | Labor Market | GDP | Fed |
CPI & Core CPI | Consumer Sentiment Index | Manufacturing PMI | Jobless Claims | GDP | FOMC meeting |
PPI & Core PPI | Consumer Credit | Services PMI | Job Openings | GDPNow (est.) | Fed Speeches |
PCE & Core PCE | PCE Consumption | New Orders | Non-farm Payroll |
| FedWatch |
| Retail Sales | Freight Index | Unemployment |
| Prediction Market |
|
|
| Wage Growth |
| FOMC meeting |
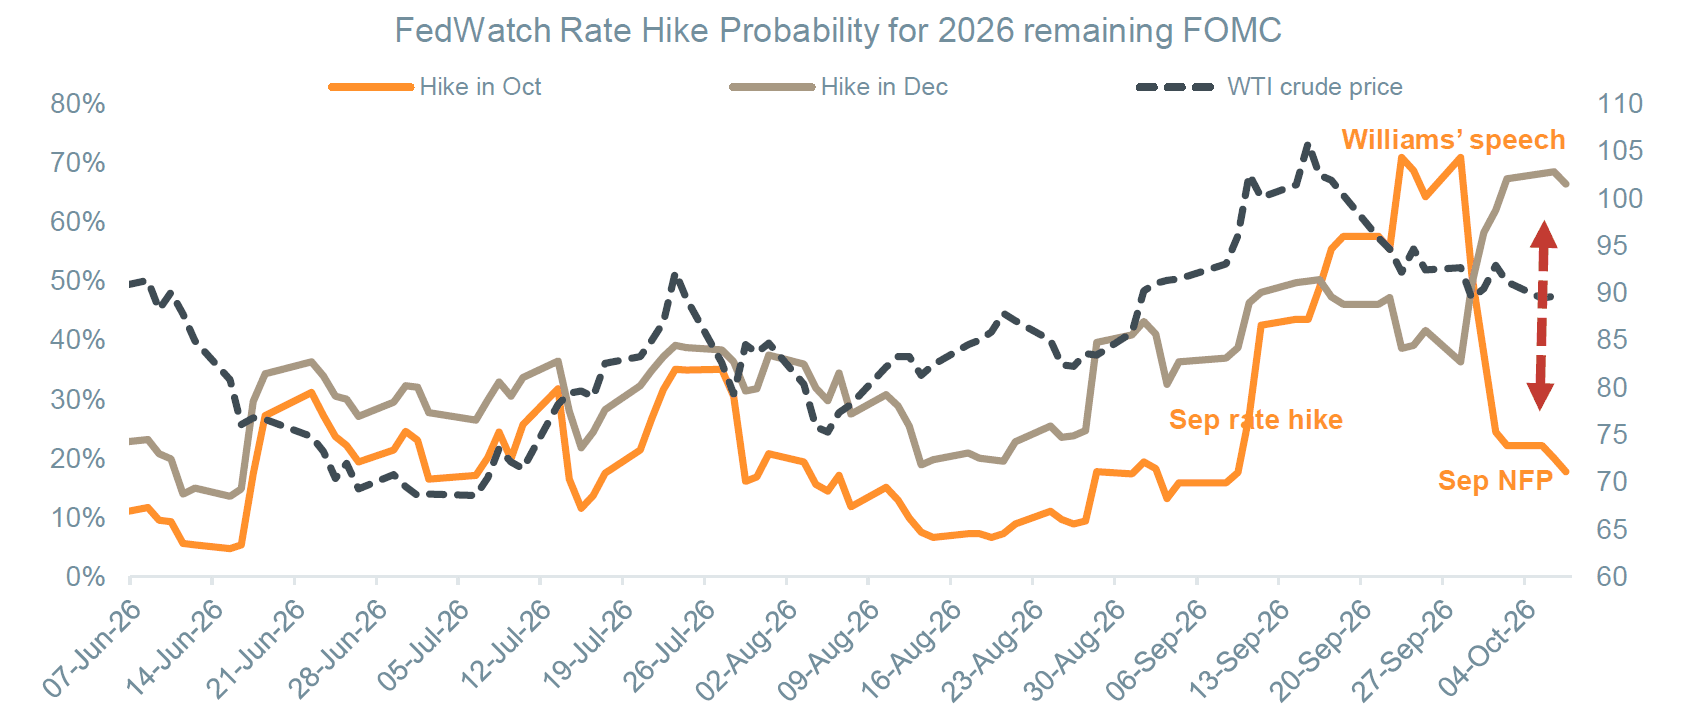
Key Conclusion: September saw a whipsaw repricing of Fed policy expectations, evidenced by a sharp drop in October rate hike odds in just one week. This dramatic change reinforces our Fed Wildcard view, with continued uncertainty in policy rates and wild swings in rate expectations. Adding to the uncertainty, the recent diesel-price spike deserves close monitoring, as it could reinforce inflation stickiness and keep the Fed hawkish for longer.
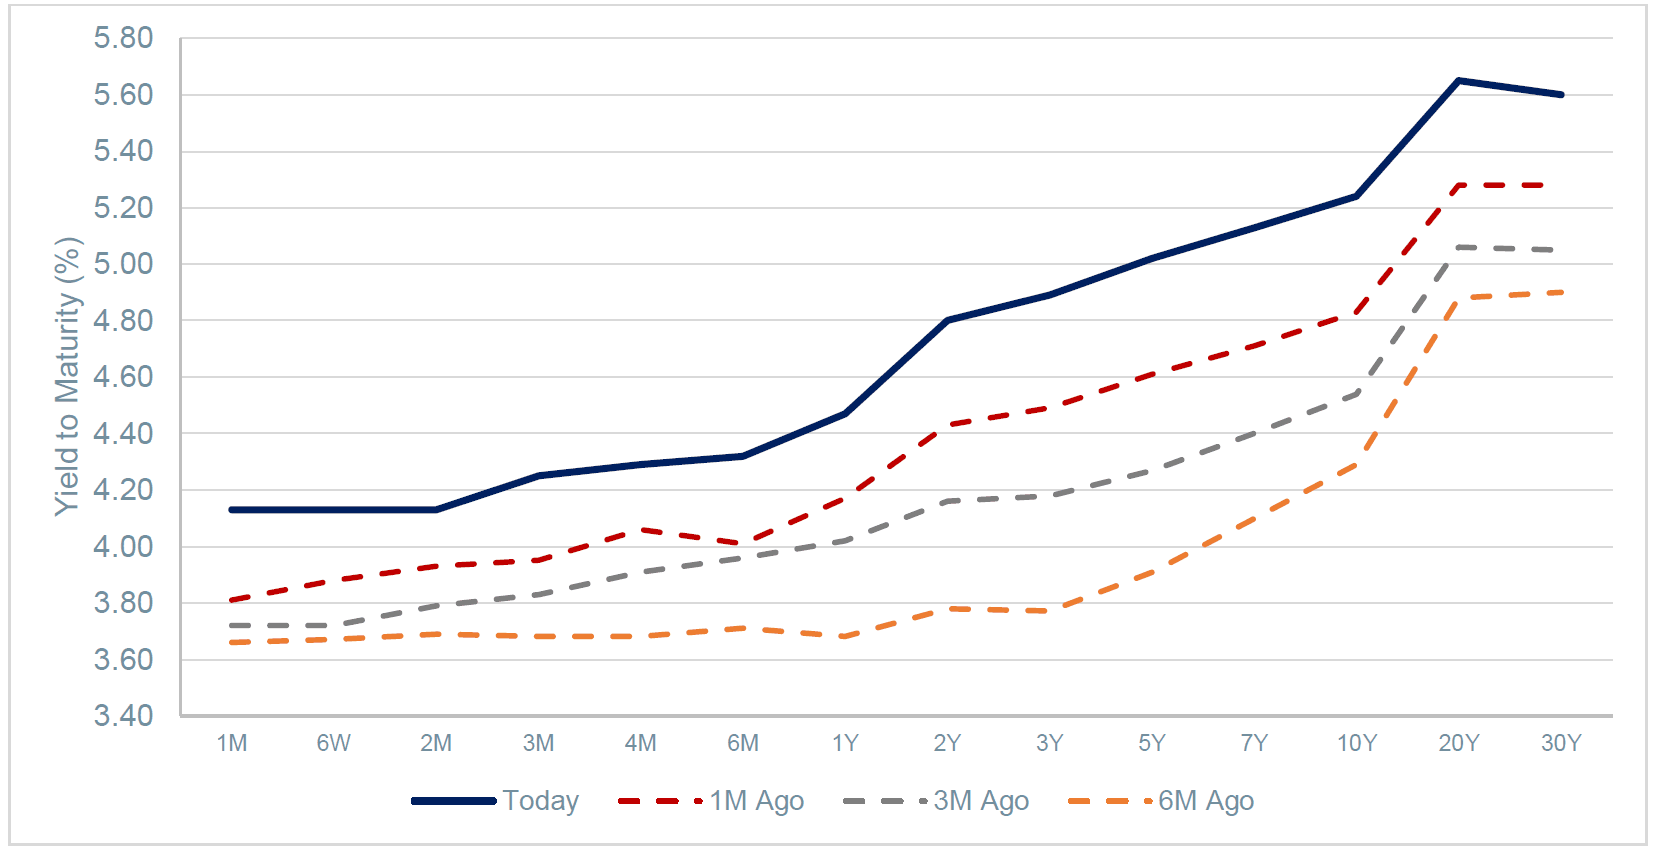
- Fed policy (Oct FOMC). Following the Fed’s first rate hike in more than three years, the market’s debate has shifted to the timing of the next hike. The Fed Wildcard was on full display in September, as the probability of an October hike plunged from 70% to 22% in just one week. This repricing was driven by a combination of cumulative data and FOMC member speeches, as Chair Warsh refrained from public communication between Fed meetings. The sharp drop in hike odds triggered a dramatic rally in the 2-to-5-year sector (prices up, yields down), while long-term yields remained elevated amid separate challenges (see Hot Topics below) – resulting in the yield curve steepening.
Rate hike timeline shifts constantly, echoing our Fed Wildcard
Source: Bloomberg, FedWatch
- Labor Market (Sep Non-farm Payroll). September’s employment report was a clear miss, with payrolls increasing by only 29K, well below the 70K consensus. The print was partially distorted by a late Labor Day holiday, with job gains highly concentrated in healthcare, construction, and AI-supported durable goods. Meanwhile, both August and July numbers have been revised lower, taking the three-month average payroll growth to 51K – the breakeven level to hold the unemployment rate steady. Indeed, unemployment edged up only 0.03ppt to 4.18% while the labor force participation rate rose just 0.2ppt to 61.8%.
- Production (Sep PMI). In stark contrast to labour market weakness, US ISM Services PMI rose to a five-year high of 58.4 in September, defying market expectations of a slowdown. The internals seem robust, with strong new orders, business activity, and employment components. The divergence between a weakening jobs market and a booming services sector is a key puzzle for the Fed currently. Services, which account for the bulk of US employment, are clearly not rolling over. The services strength complicates any dovish narrative and is perhaps the primary reason keeping the Fed from pivoting to rate cuts.
- Inflation (Aug PCE and BEA methodology change). The August PCE report was benign on the surface, with core inflation up 3.0% vs. the expected 3.3%. However, August’s PCE data require careful reassessment in light of a revision to the Bureau of Economic Analysis (BEA) methodology. In short, BEA recently changed seasonal adjustment factors and updated its weighting methodology, leading to a slight downward bias in recent prints. This technical recalibration ultimately works in favor of the Fed holding rates, as it removes the artificial upward pressure that had previously emboldened the Fed's hawkish camp.
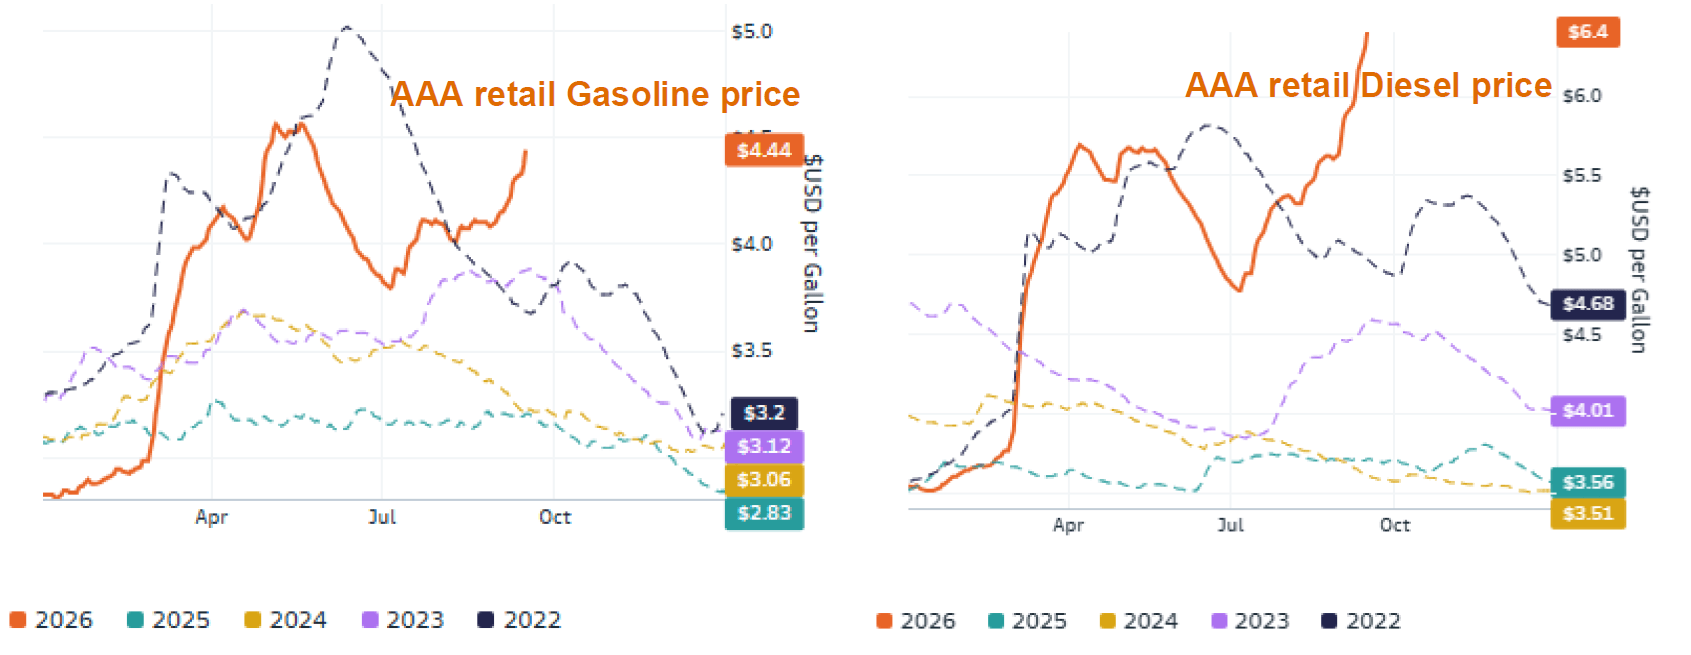
- Diesel is now a key inflation bellwether. Amid the second wave of rising energy price since July, diesel prices have increased significantly faster than gasoline, reflecting tighter middle-distillate supply alongside resilient US PMIs. Higher diesel prices can quickly feed into freight, logistics and input costs, creating broader inflationary pressure than gasoline. If sustained, the diesel spike could reinforce inflation stickiness and keep the Fed hawkish for longer. We are watching this closely.
Rallying diesel price (above the 2022 peak) is a key thing to watch for inflation outlook
Source: Bloomberg, Goldman Sachs Research
Hot Topic: Unpacking the Long-term Yield Surge – Why Higher for Longer
US Treasury Yields 1-month Movement
Source: UOB Kay Hian, Bloomberg, as of Oct 12, 2026
In our June 2026 Fixed Income Monthly, we explicitly warned that the 10-year Treasury yield may trade at a new norm of above 4.5%. That prediction has been spot-on, and our “higher-for-longer” view on long-term yields remains intact. Let’s revisit both macro and micro forces behind the current surge in yields, and see whether this trend is likely to continue.
- Higher inflation expectations. Energy market pressures (elevated oil prices) and broadening core price stickiness (from services to rents etc.) have kept inflation expectations above the Fed’s 2% target, limiting the scope for markets to pricing in future monetary easing. Result: higher long-term yields.
- Stronger growth expectations. Despite a K-shaped bifurcation, the US economy remains surprisingly strong, supported by resilient consumer spending, private investment (AI capex) and robust corporate earnings. Such strength keeps real growth expectations firm and further delays any expectations for rate cuts. Result: higher long-term yields.
- Rising term premium. Structural deficits are expanding in the US and other developed countries (see below). A populism shift along with election season dynamics could increase federal spending and further worsen the US debt burden. Rising fiscal concerns are lifting the term premium, as investors demand greater compensation for holding long-duration Treasuries. Result: higher long-term yields.
- Crowding out from AI-driven debt supply. Staggering AI capex is driving massive long-dated corporate debt issuance, which is flooding the market, competing for investor capital and adding upward pressure on government bond yields. Please see the US Credit section below for more information. Result: higher long-term yields.
All four forces above are unlikely to reverse in the near term, keeping long-term yields higher for longer. We hereby reiterate our June view that the new floor for 10-year yields sits at around 4.5%, while the top of the range remains difficult to gauge (the latest peak was 5.34%).
Therefore, we maintain our Core Recommendation on short-duration (< 3 years), top-rated (A and above), investment-grade bonds. We suggest investors avoid aggressively adding duration until a clearer trading range for long-term yields is established.
Hot Topic: Europe the Next Pressure Point
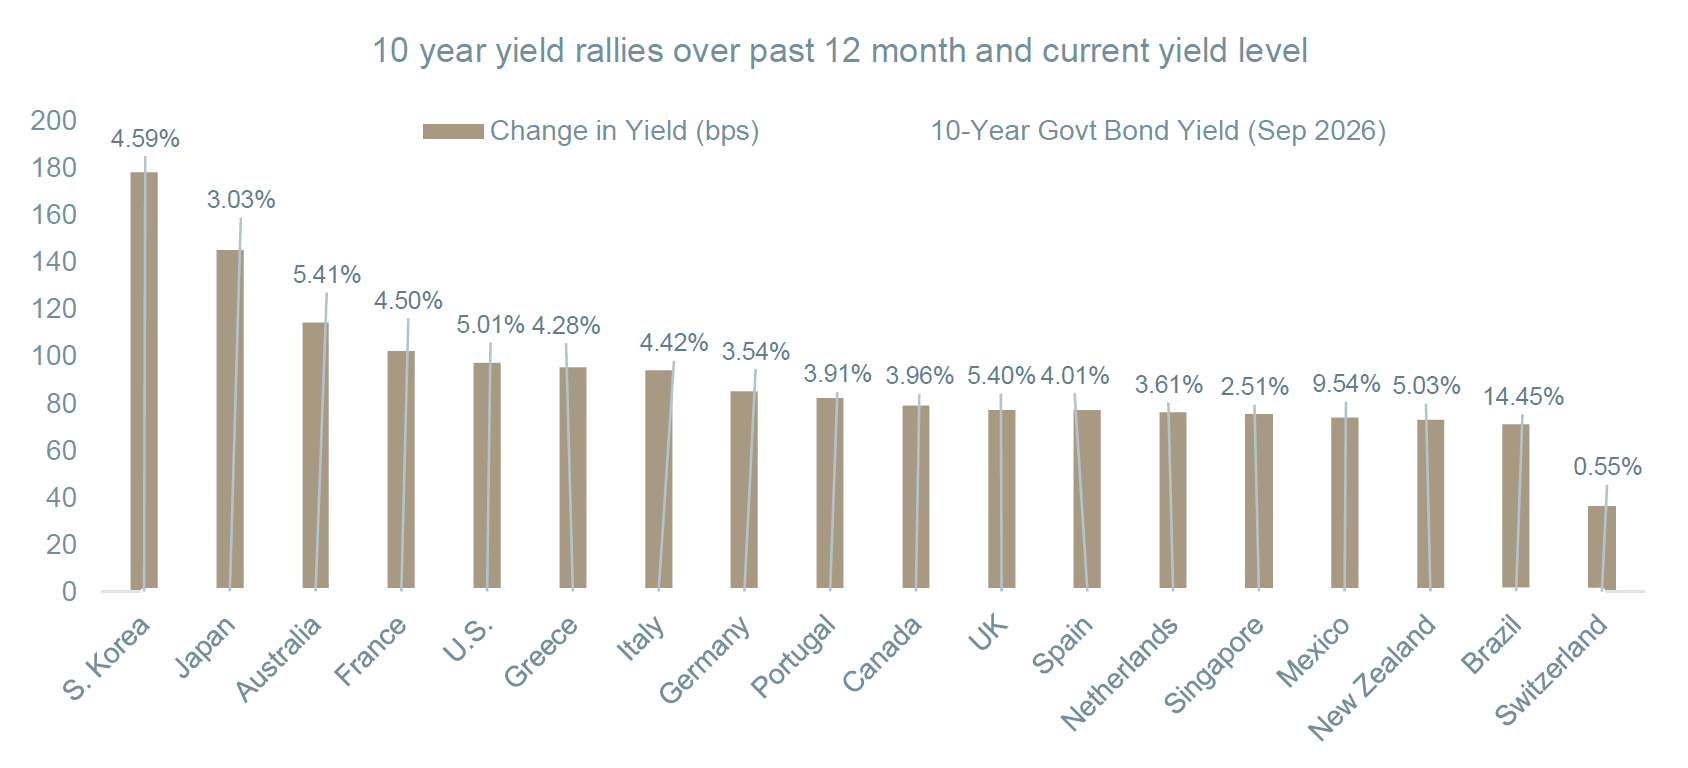
The upward pressure on long-term yields is not confined to the US, as sovereign yields are also surging globally (see chart below). Europe, in particular, has re-emerged as a key pressure point, highlighted by escalating fiscal strains in France. France’s 10-year borrowing costs have risen toward 5% (highest since 2002), with a budget deficit second only to the US. With over USD 1 trillion in French debt coming due by 2030 and record bond sales looming, investors are demanding greater compensation for taking French sovereign risk, reinforcing our view that "higher-for-longer" is a global phenomenon.
Is another Euro debt crisis brewing? Our research partner Longview Economics thinks the warning signs are flashing, with sovereign spreads widening, liquidity tightening and fiscal concerns resurfacing. Stress could intensify before policymakers step in, meaning things could get worse before they get better. Against this backdrop, Europe is emerging as pressure point that we need to monitor closely, but it is too early to call a full-blown crisis.
Long-term bond yields are rising globally, alongside structural fiscal expansions worldwide
Source: Bloomberg
Credit View
US Credit: Crowding Out from AI-Driven Debt Supply
US corporate bonds continue to offer attractive yields, but record AI financing is increasing the amount of debt investors need to absorb – potentially crowding out demand for both Treasuries and other corporate bonds. That, in essence, is AI crowding-out argument.
- AI financing remains a multi-year theme for fixed income, despite a relatively quiet September. Morgan Stanley estimates global AI-related debt issuance of USD 466bn through September, compared with USD 216bn in all of 2025. The MS classification recorded no US investment-grade AI issuance in September. Goldman Sachs also believes much of this year’s funding by hyperscalers and other Big Tech issuers is largely complete. However, future borrowing could rise as data centre projects progress. Goldman highlights estimated financial commitments of USD 2.8tn across leases, guarantees and purchase obligations. These commitments are separate from outstanding bond debt, but they are still important considerations in credit analysis.
- New AI bonds could crowd out long-term Treasuries by competing for investor capital. Insurers, pension funds and tactical traders may choose high-quality corporate bonds for the yield pick-up over government debt. Goldman Sachs noted that parts of the corporate bond market increasingly trade like rates products, helping explain the growing overlap between Treasuries and IG corporate bonds. A significant share of new corporate bond issuance is now related to AI, meaning AI financing may increasingly compete with US Treasuries for investor demand. Therefore, it is not far fetched to say that AI is contributing to rising 10-year yields.
- The same crowding-out effect extends to other corporate bonds, with major implications for market structure, sector concentration and credit spreads etc. So far, the impact of AI financing on credit spreads appears limited, likely supported by a resilient US economy. But this does not mean the risk should be dismissed. Morgan Stanley’s September-end data show IG spreads of about 80bps and an average yield-to-worst of 6.0%, while HY spreads stood at 311bps. Goldman Sachs estimates that spreads account for less than 15% of IG yields as of October. However, Goldman also warns that sharp swings in interest rates could make investors more cautious, prompting spreads to widen.
- AI or not, bond issuance remains strong across the board. JPMorgan reports USD 197bn of US high-grade issuance in September, resulting in a record USD 503bn in 2Q and bringing the YTD total to USD 1.69tn +30% yoy. Financial institutions issued USD 86bn in September, while acquisition financing contributed USD 61bn across sectors. Meanwhile, investors received cash from maturing bonds and coupon payments – available for reinvestment. After these payments, JPMorgan puts September’s additional supply at just USD 40bn. This helps explain why heavy issuance has yet to materially widen spreads.
- Wall Street’s sector recommendations. Goldman Sachs prefers select BBB bonds over higher-rated AA and A papers for their additional spread, and sees banks, energy and healthcare as sectors to diversify away from AI. Morgan Stanley favours strong hyperscalers and completed infrastructure with reliable tenants and clear creditor protections. For project debt, construction delays, access to power and guarantees warrant close attention. In any case, expect further spread volatility before December, although slower year-end issuance could later provide some support. Selection should therefore balance credit strength, interest-rate sensitivity and future funding needs.
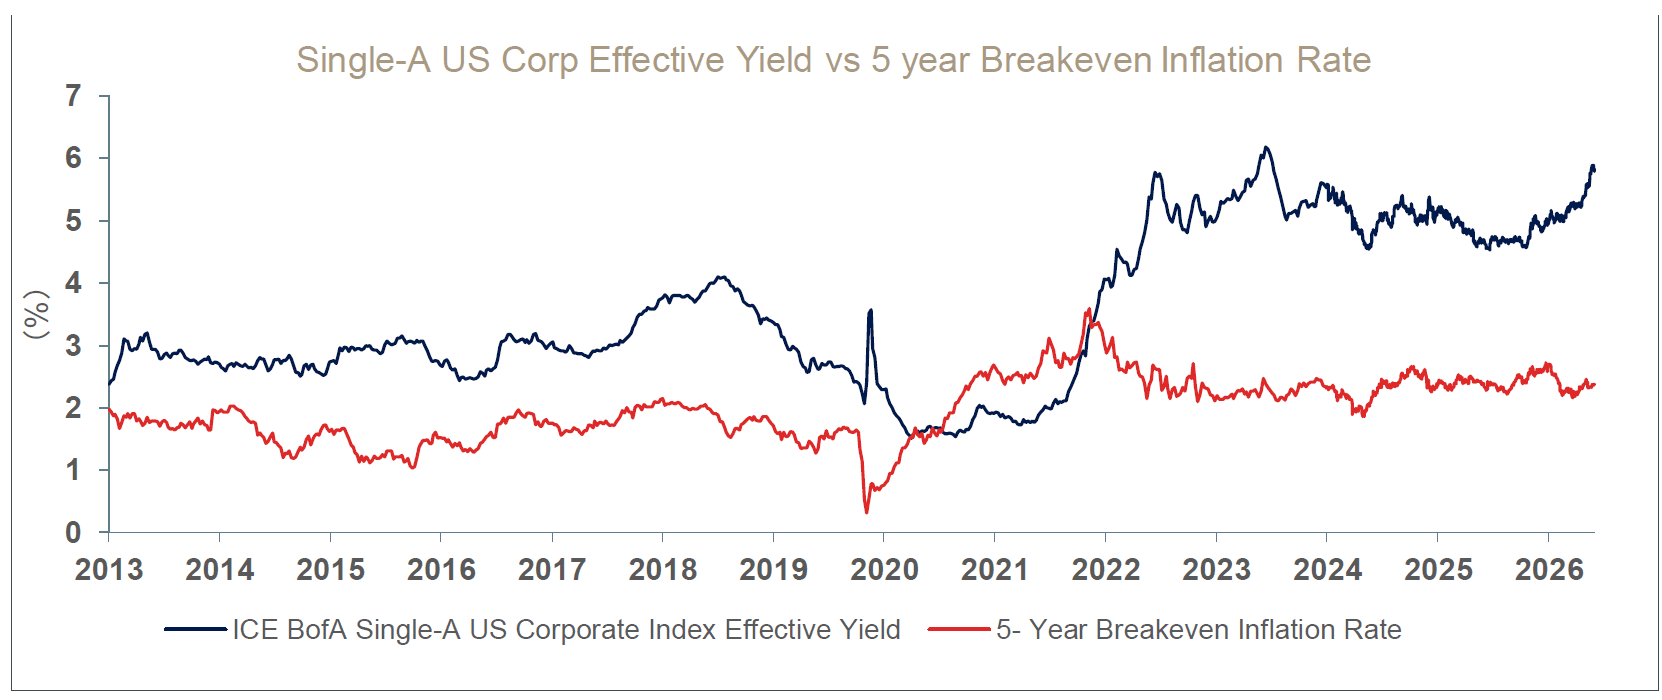
Single-A US Corp Effective Yield vs 5 year Breakeven Inflation Rate
Source: https://fred.stlouisfed.org
Notes:
ICE BofA Single-A US Corporate Index Effective Yield: based on a subset of the ICE BofA US Corporate Master Index, i.e. all securities with the investment grade rating A. 5-Year Breakeven Inflation Rate: The breakeven inflation rate represents a measure of expected inflation derived from 5-Year Treasury Constant Maturity Securities (BC_5YEAR) and 5-Year Treasury Inflation-Indexed Constant Maturity Securities (TC_5YEAR). The latest value implies what market participants expect inflation to be in the next 5 years, on average. Starting with the update on June 21, 2019, the Treasury bond data used in calculating interest rate spreads is obtained directly from the U.S. Treasury Department.
Asia Credit: Unique Opportunities Beyond AI
- AI financing in Asia is modest relative to the US, reflecting fewer and smaller hyperscalers, lower AI capex, limited financial resources and the US tech sanctions on China – which restricts access to advanced AI chips. There is also a structural reason: There are many Asian firms in the global AI supply chain – such as TSMC, SK Hynix and Samsung – that are getting paid for the AI buildout rather than paying for it.
- The AI investment cycle is indeed improving the credit outlook for select Asian technology suppliers. Bloomberg Intelligence identifies around USD 24bn of bonds with potential for rating upgrades, led by TSMC, SK Hynix and Kioxia (candidates, not yet confirmed). TSMC benefits from its lead in advanced chips and strong cash generation, although its overseas factory expansion carries execution risk. SK Hynix and Kioxia are riding on the AI-driven Memory Supercycle, with sustainable earnings growth for industry leaders, in our view. Meanwhile, Bloomberg sees less immediate upgrade potential for Xiaomi because of higher component costs and electric-vehicle losses, and holds the same view for Hon Hai due to its heavy investment using cash.
Beyond AI, there is plenty happening across Asia’s credit markets, which makes the region a dynamic source of diversification.
- Singapore banks remain well supported by strong capital buffers. Bloomberg Intelligence reports common equity tier 1 ratios of 14.6% / 14.0% / 15.0% for DBS, OCBC and UOB respectively, on a fully phased-in basis. Their securities holdings and interest-rate hedges should help limit the impact from rising bond yields. Separately, JPMorgan expects limited credit spread disruption from the proposed total loss-absorbing capacity framework, which requires eligible capital and debt equal to 14% of risk-weighted assets. Banks have five years to comply after formal notification, allowing them to pace new borrowing over time. Final rules are still pending, and not all existing capital qualifies.
- Funding is still needed yet differs across Singaporean banks. Bloomberg estimates a larger shortfall in eligible loss-absorbing funding at DBS than peers. Pricing matters: JPMorgan is cautious on the relative value of DBS’s AUD 2031 bond, offered at 59 basis points above the swap benchmark and a 5.6% yield. The concern is valuation, rather than a deterioration in DBS’s credit standing. A strong issuer can remain financially sound while offering too little additional yield compared with alternatives.
- Favouring Malaysian banks with stable funding and adequate capital. Malaysian banks are seeing stronger lending demand, including data-centre financing, but deposits also need to keep pace. Bloomberg reports August loan growth of 5.7% yoy against deposit growth of 5.2%. Three-month KLIBOR, an interbank funding benchmark, rose to 3.55% on October 6 from 3.28% at the start of the year. Higher funding costs can reduce banks’ net interest margin, yet Maybank’s larger low-cost deposit base provides some protection. We favour banks with stable funding and adequate capital, alongside technology companies with sustained cash flows. Bond selection should also account for valuation, liquidity and refinancing needs.
- Selectivity remains key in CNH bonds. The offshore renminbi (CNH) bond market is growing and attracting a wider range of issuers. JPMorgan’s August analysis puts outstanding credit bonds at RMB 1.14tn (USD 170bn), more than four times the 2021 level. More offshore renminbi cash and Southbound Bond Connect flows have supported demand, while borrowers are issuing across more sectors and longer maturities. However, growth does not make every CNH bond good value. JPMorgan finds that, after swapping yields into USD, the CNH index offers around 80 basis points less yield on average than USD peers. Selected companies, non-bank financials and longer-dated non-Chinese issuers still offer opportunities. Comparisons should include currency-hedging costs, maturity and ease of trading.
In summary, Asian credit continues to offer attractive income and differentiated opportunities, supported by AI capex beneficiaries, high-quality banks and select CNH bonds.
Asia Pacific Key Sovereign Rates Monitor
Region | 2 Year | 5 Year | 10 Year | 30 Year |
Australia | 4.91 | 4.98 | 5.33 | 5.79 |
China | 1.23 | 1.38 | 1.67 | 2.09 |
China (USD) | NA | NA | NA | NA |
India | 6.72 | 6.93 | 7.30 | 7.72 |
Indonesia | NA | 6.98 | 7.16 | 7.21 |
Indonesia (USD) | 5.08 | 5.61 | 6.19 | 6.41 |
Japan | 1.90 | 2.33 | 3.00 | 4.05 |
Malaysia | NA | 3.62 | 3.93 | 4.40 |
New Zealand | 3.81 | 4.46 | 5.03 | 5.58 |
Pakistan | NA | 12.18 | 12.57 | NA |
Philippines | 6.54 | 7.54 | 7.76 | NA |
Philippines (USD) | 4.86 | 5.59 | 6.22 | NA |
Singapore | 1.89 | 2.18 | 2.42 | 2.49 |
South Korea | 3.90 | 4.16 | 4.40 | NA |
South Korea (USD) | 4.22 | 4.37 | NA | NA |
Taiwan | 1.65 | 1.77 | 1.86 | 2.25 |
Thailand | 1.23 | 1.70 | 2.31 | 3.25 |
Source: Bloomberg, as of Oct 12, 2026
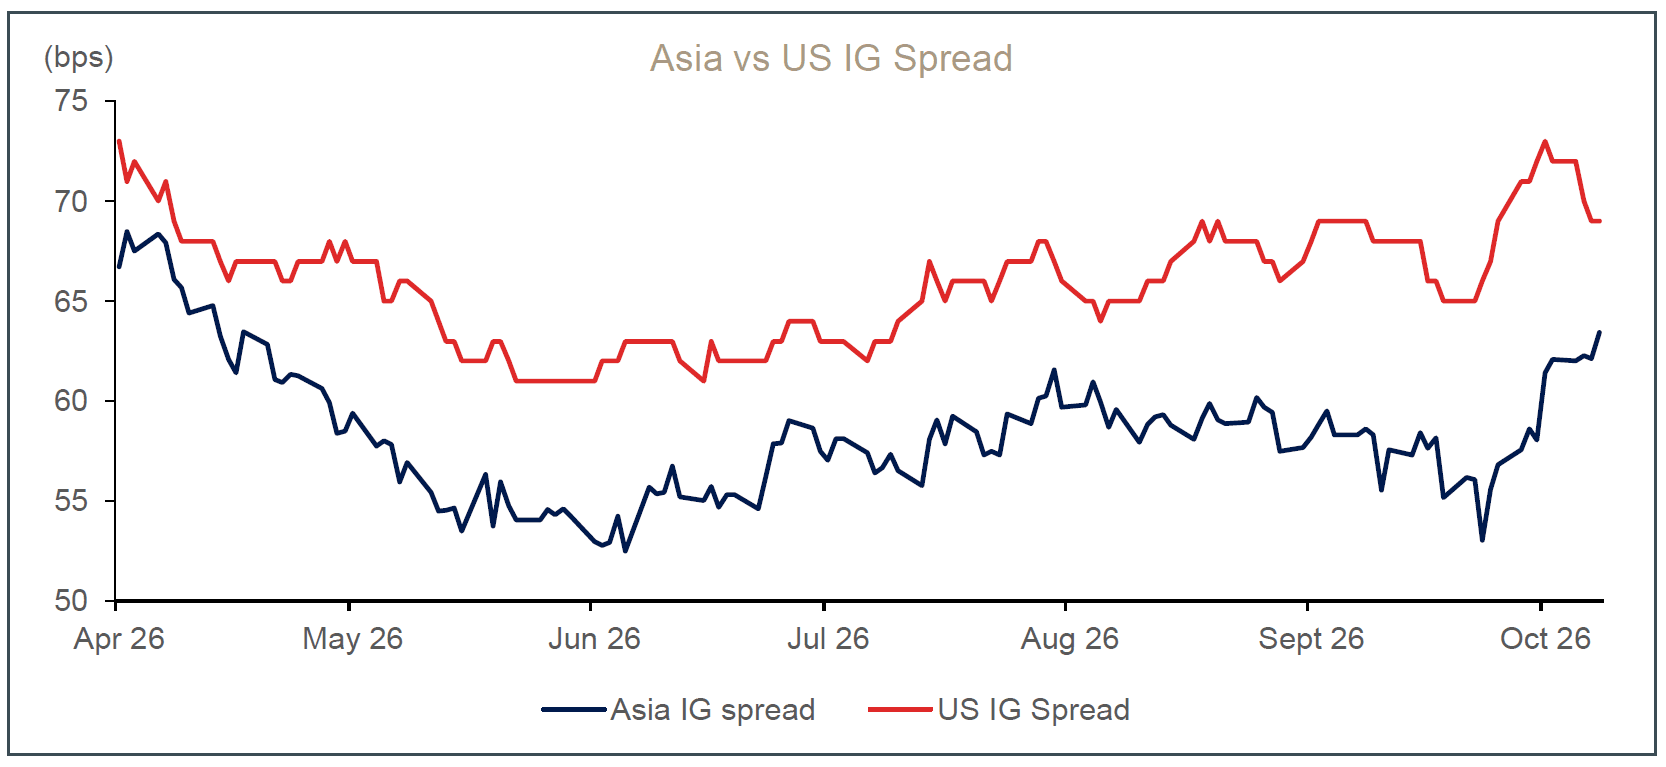
Credit Spreads
Source: Bloomberg
Asia IG Spread: Bloomberg EM Asia USD Credit High Grade Average OAS (BEUGOAS)
US IG Spread: ICE BofA Single-A US Corporate Index Option-Adjusted Spread (BAMLC0A3CA)
Source: Bloomberg
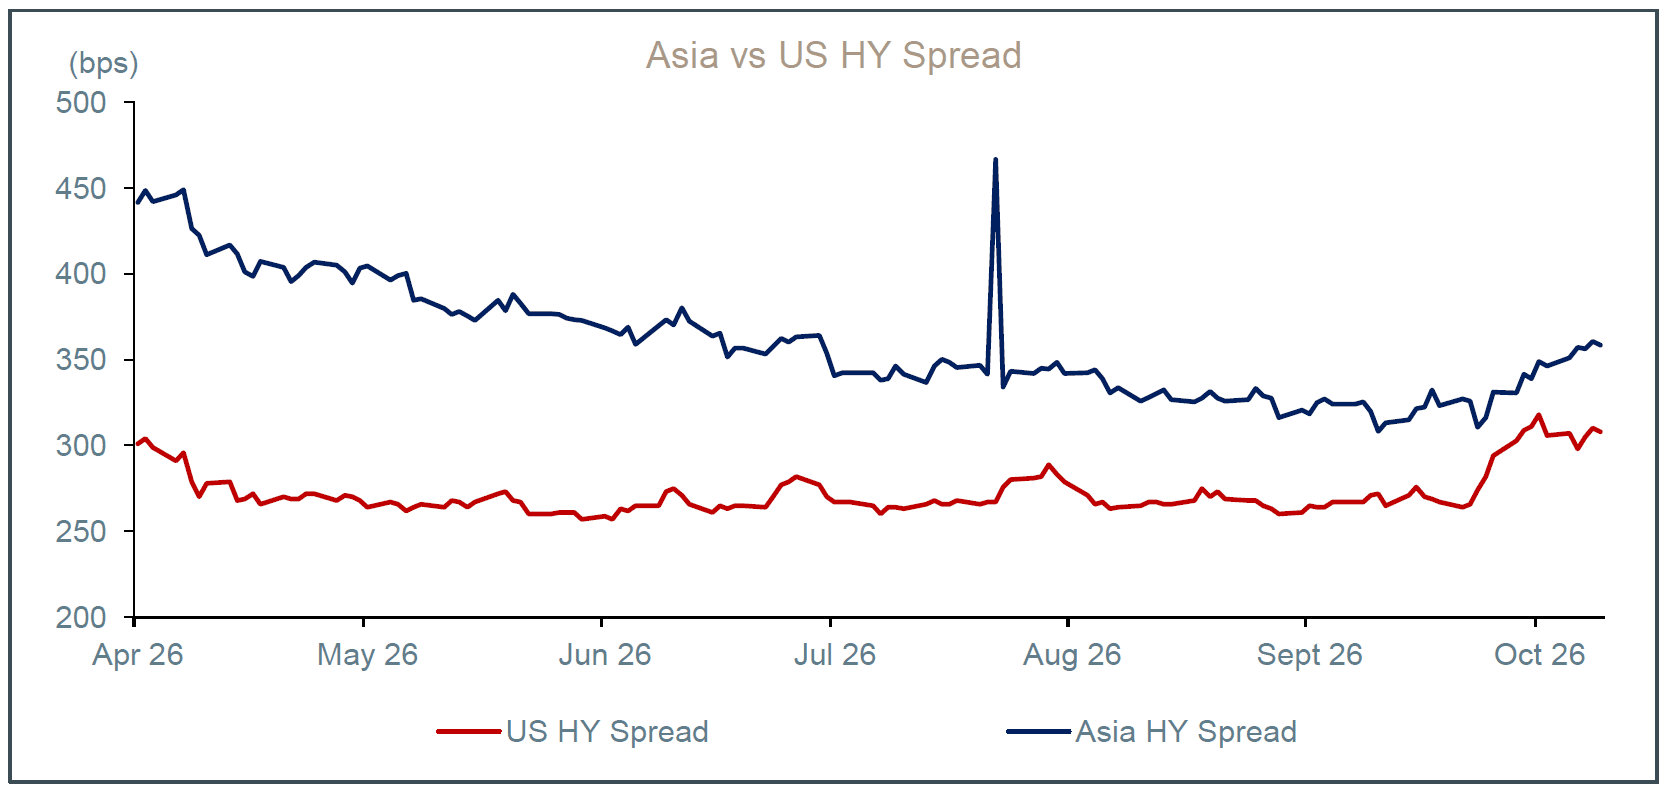
Asia HY spread: Bloomberg Asia USD High Yield Bond Index Average OAS (BAHYOAS)
US HY Spread: Bloomberg US Corporate High Yield Average OAS (LF98OAS)
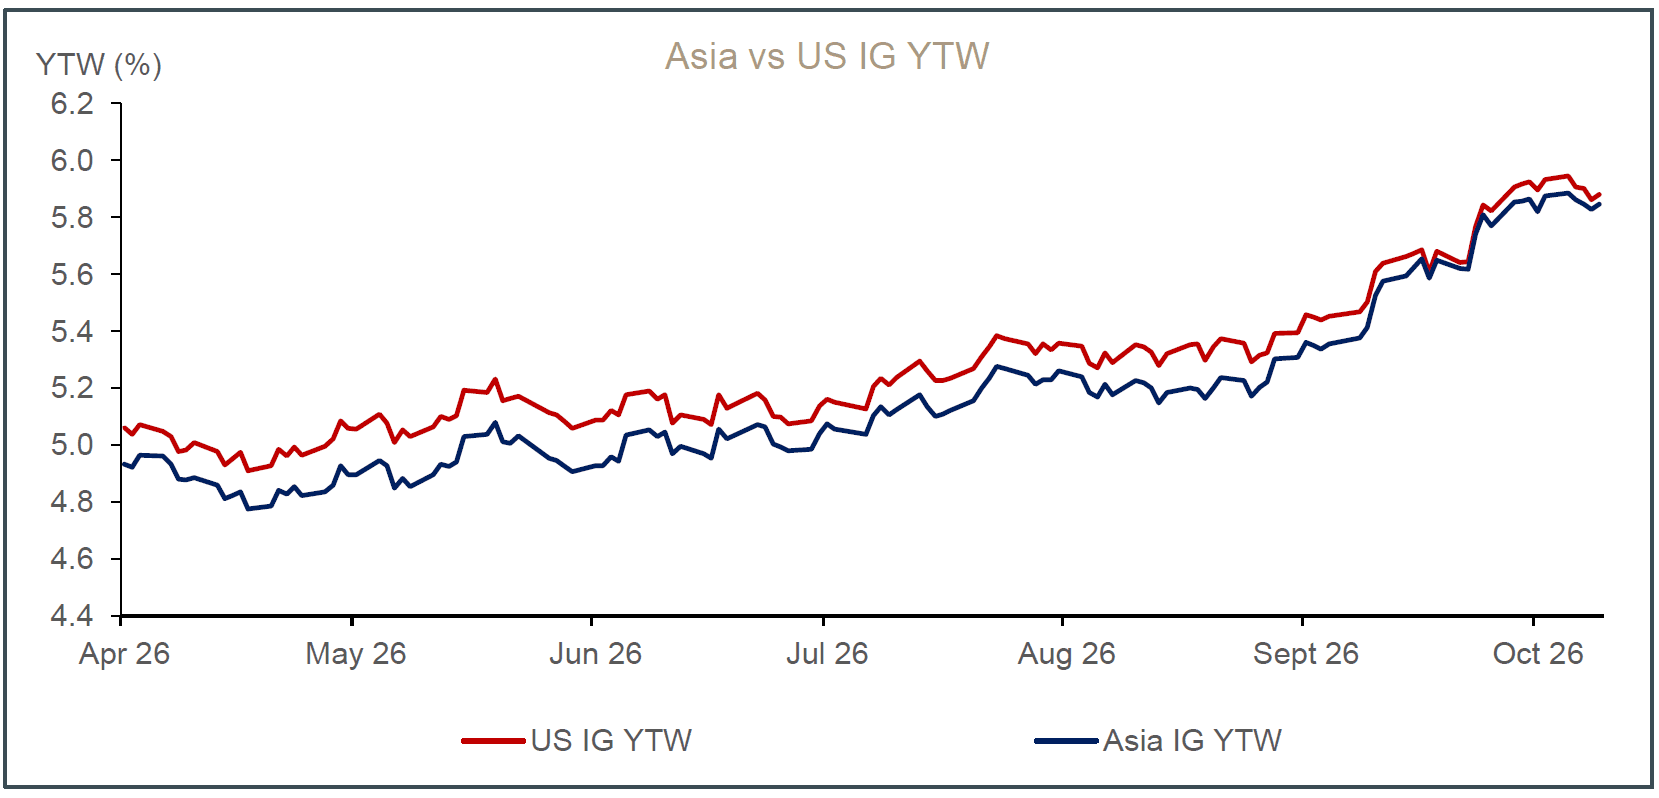
Credit Yields
Source: Bloomberg
Asia IG YTW: Bloomberg Asia Ex-Japan USD Credit Corporate IG (I29385)
US IG YTW: S&P US Investment Grade Corporate Bond Index Yield to Worst (SPUIGBDW)
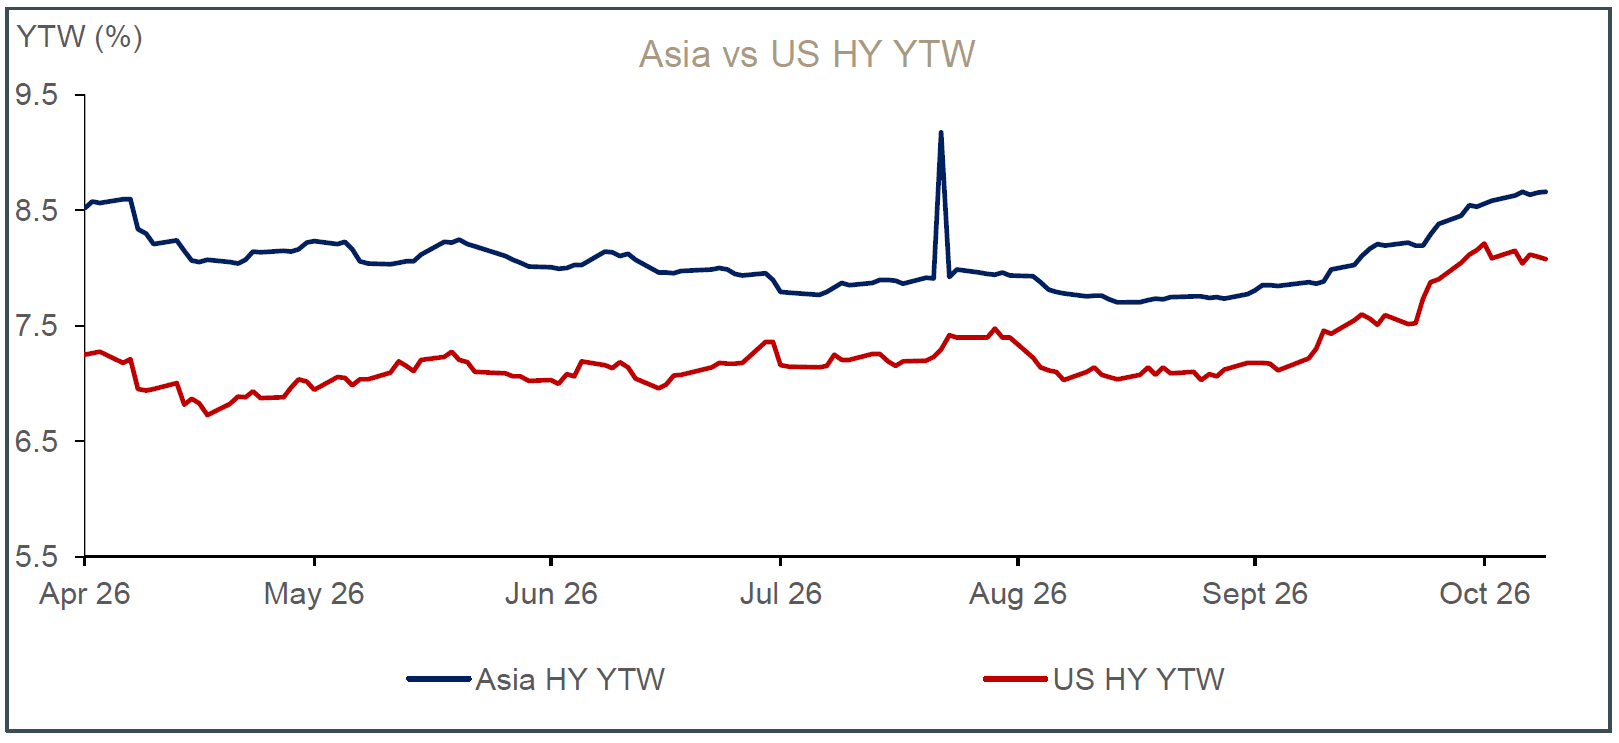
Source: Bloomberg
Asia HY YTW: Bloomberg Asia USD High Yield Bond Index Yield to Worst (BAHYYW)
US HY YTW: S&P US High Yield Corporate Bond Index Yield to Worst (SPUHYBDW)
Bond ETF and Fund Radar
Key Risks for Investing in Bond Funds
- Market risk: Bond prices can fall due to rising interest rates, widening credit spreads, economic slowdowns, or issuer-specific issues.
- Currency risk: FX movements can significantly affect returns.
o Stronger USD boosts unhedged foreign holdings in SGD terms.
o Weaker USD can offset or even reverse bond gains.
- Hedged share classes: Many funds offer SGD, EUR, AUD, HKD, or CNH-hedged classes to reduce FX volatility and focus on credit and duration exposure.
High-Yield Exposure
- Global bond funds may hold both investment-grade and high-yield bonds.
- High-yield bonds carry higher default, macro, and liquidity risks.
- This means greater price volatility and potential capital losses, especially if the exposure is unhedged in a weakening currency.
Key Considerations
- Past performance is not indicative of future results.
- Yield alone should not drive investment decisions.
- If diversifying away from USD amid de-dollarisation trends, compare:
o Hedged share classes
o Hedging costs
o Overall risk–return profile
Bond ETF and Fund Radar: Key Facts
Name | Category | Duration Type | Expense | Effective Duration | Average Yield | Credit Quality |
Vanguard Short-Term Corporate Bond ETF (VCSH US) | Investment Grade ETF | Short | 0.03% | 2.7 | 5.50% | 55.06% in A rated and above 44.86% in BBB rated Average Quality – A- |
iShares Core U.S. Aggregate Bond ETF (AGG US) | Investment Grade ETF | Intermediate | 0.03% | 5.69 | 5.48% | 87.64% in A rated and above 11.54% in BBB rated Average Quality – AA |
iShares iBoxx $ Investment Grade Corporate Bond ETF (LQD US) | Investment Grade ETF | Long | 0.14% | 7.53 | 6.11% | 58.79% in A rated and above 40.23% in BBB rated Average Quality – A- |
HSBC Short Duration Bond Fund | Investment Grade UT | Short | 0.70% | 2.45 | 5.35% | 42.12% in A rated and above 44.92% in BBB rated 10.01% in HY Average Quality – A-/BBB+ |
PIMCO GIS Income Fund | Investment Grade UT | Intermediate | 1.45% | 7.36 | 8.37% | 79.20% in A rated and above 11.20% in BBB 9.50% in HY Average Quality – AA- |
Fidelity US Dollar Bond Fund | Investment Grade UT | Long | 1.03% | 6.3 | 4.98% | 81.47% in A rated and above 13.07% in BBB 1.79% in HY Average Quality – AA- |
Source: Bloomberg, MorningStar, iShares and Vanguard as of Oct 12, 2026. US listed ETFs might subject investors to a 30% withholding tax on all dividends received. Please consult your tax consultant for further information.
Bond ETF and Fund Radar (continued): Performance Data
Fund Name | ISIN / Ticker | Currency | 1 Month Total Return (%) | YTD Total | 1 Year Total Return (%) |
HSBC GIF Global Short Duration Bond Fund | LU1163226092 | USD | -0.10 | 1.14 | 2.05 |
LU1272399756 | SGD | -0.30 | -0.88 | -0.65 | |
LU2639850283 | EUR | -0.22 | -0.22 | 0.19 | |
PIMCO GIS Income Fund | IE00B7KFL990 | USD | -1.76 | -2.92 | -1.14 |
IE00B9HH6X13 | SGD | -1.94 | -4.88 | -3.78 | |
IE00B84J9L26 | EUR | -1.85 | -4.23 | -2.95 | |
Fidelity Funds - US Dollar Bond Fund | LU0261947682 | USD | -1.35 | -3.78 | -3.52 |
LU2605879787 | SGD | -1.49 | -5.72 | -6.06 | |
LU2730164063 | EUR | -1.53 | -5.12 | -5.31 | |
Vanguard Short-Term Corporate Bond ETF (VCSH US) | VCSH US | USD | -0.16 | 0.25 | 1.35 |
iShares Core U.S. Aggregate Bond ETF (AGG US) | AGG US | USD | -1.10 | -2.38 | -1.96 |
iShares iBoxx $ Investment Grade Corporate Bond ETF (LQD US) | LQD US | USD | -1.41 | -3.73 | -3.65 |
Bloomberg US Aggregate Total Return Index | LBUSTRUU Index | USD | -1.07 | -2.48 | -1.98 |
Source: Bloomberg as of Oct 12, 2026. Based on the accumulative share class for unit trust (no fund dividends) and dividend reinvestment for ETF.
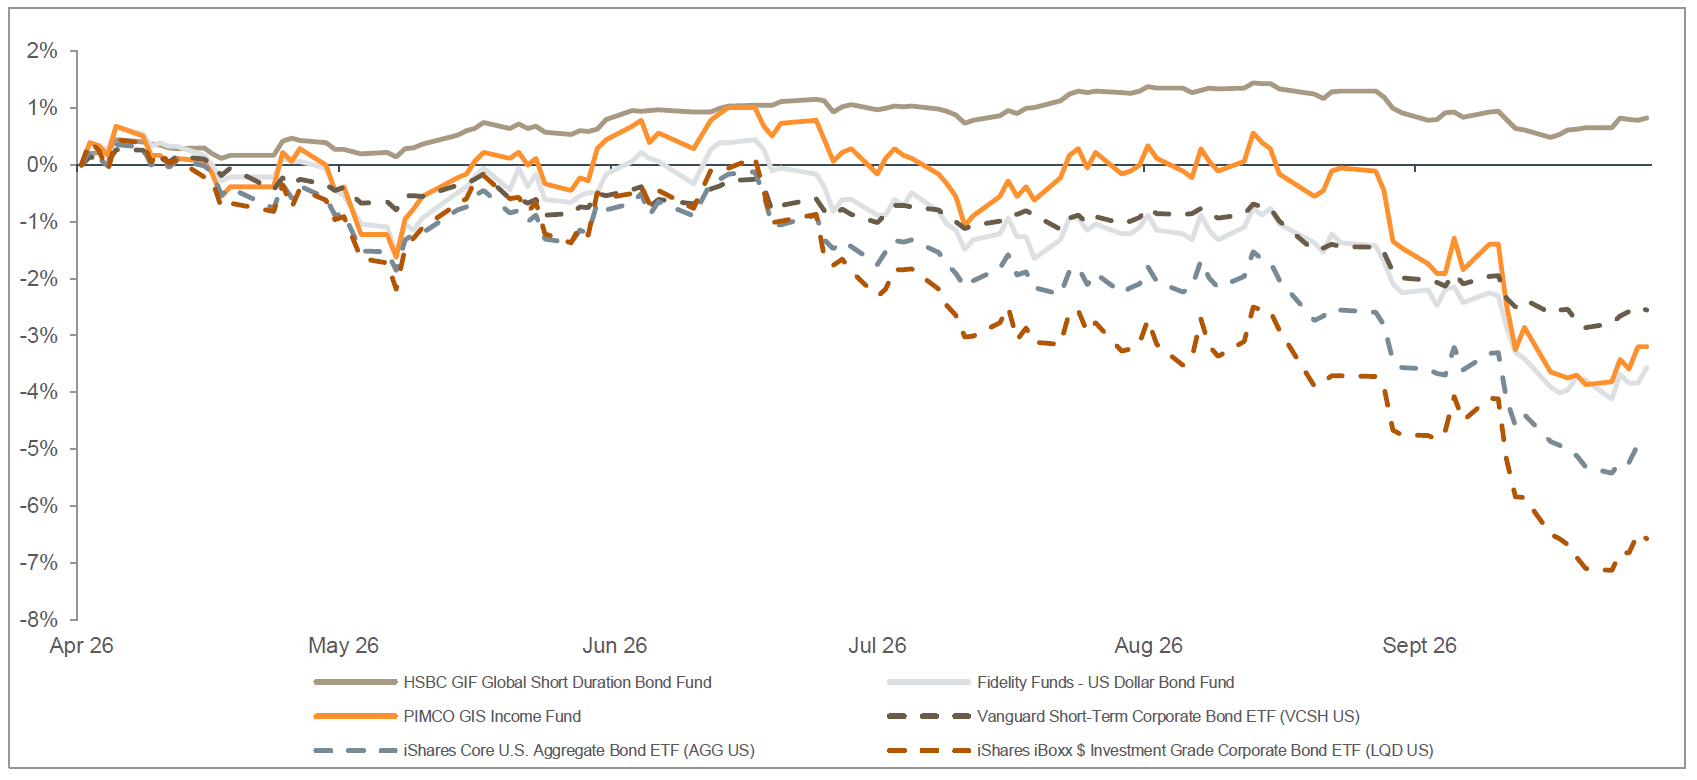
Investment Grade Bond ETF and Fund 6 Month Performance (Apr 12 to Oct 12, 2026)
Source: Bloomberg
Notes: This represents the performance of fund NAV in the specific time period. The performance is affected by the coupon received, dividend paid (if applicable), mark to market prices of the bond holdings and management fees, etc. The unit trusts selected are accumulative share class, ie no dividends.
Glossary
Average Coupon: the weighted average of the various coupons of a bond portfolio.
Average Credit Quality: the weighted average of each bond’s credit rating in a portfolio. See Average Rating below.
Average Duration: the sensitivity of the value of a bond portfolio to interest rate changes. The longer the duration, the more sensitive toward interest rate changes.
Average Rating: the weighted average rating of all bonds in a portfolio. For example, a portfolio with 25% in AAA, 25% in BBB and 50% CCC bonds would have a weighted average credit rating of B+, which is between BBB and CCC.
Average Yield To Maturity: the rate of return required for the present value of all the future cash flows of a bond portfolio to equal the current bond price.
Yield To Worst (YTW): a measure of the lowest possible yield on a bond that fully operates within the terms of its contract without defaulting. It is based on the earliest call or retirement date, assuming that a prepayment of principal occurs if a bond issuer uses the call option.
Effective Duration: see Average Duration above.
Effective Maturity: the date used in place of the final maturity for bonds with call, put or prepayment features.
Running Yield: coupon divided by a bond portfolio’s market price. This is different from Yield to Maturity as the Running Yield does not take into account if the bond market price is below or above Maturity redemption value.
FOR PROFESSIONAL INVESTORS OR ACCREDITED INVESTORS OR RELEVANT PERSON (CKA) ONLY
CIO Summary
- Fed Wildcard in full play. September’s sharp repricing of Fed expectations reinforces our Fed Wildcard view, with continued policy uncertainty and wild swings in rate expectations. The diesel price spike adds to the risk of sticky inflation and a hawkish Fed, warranting close monitoring.
- AI financing contributing to surging 10-year Treasury yields? Yes, we think so. We see at least four forces pushing long-term yields higher, including crowding out from AI debt issuance.
- Reiterating our June view: higher for longer. All four forces are unlikely to reverse in the near term, keeping long-term yields higher for longer. We reiterate our June view that 4.5% represents the new floor for 10-year yields while the top of the range remains difficult to gauge.
- Europe: the next pressure point? Surging sovereign yields and mounting fiscal strains, particularly in France, reinforce our higher-for-longer view outside the US. Stress could worsen before policymakers respond, but it is too early to call another euro debt crisis.
- Call to Action. We maintain our Core Recommendation on short-duration (< 3 years), top-rated (A and above), investment-grade bonds. We suggest investors avoid aggressively adding duration until a clearer trading range for long-term yields is established.
- Bond highlight: META 4.8% 15 May 2030
Bond Radar
Below is a list of popular investment-grade (IG) bonds curated by our Products Team. These are for reference only and do not constitute our recommendations. For further details, please contact our fixed-income & credit specialist, Benjamin Tan Shun Chao at benjamintan@uobkh.com.
Asia Non-Financial Corporates
Company | Bond Name | ISIN | Current Price (Oct 12) | YTM (%) | Duration (y) | 6M Performance (%) |
Abu Dhabi | TAQAUH 4.375% | XS2600246552 | USD 97.43 | 5.59 | 2.11 | -2.07 |
Abu Dhabi’s government-owned energy and water conglomerate with the world’s largest single-site solar power plant and other renewables. | ||||||
Singtel | STSP 2.375% | XS2046591413 | USD 92.78 | 5.11 | 2.71 | -1.58 |
State-owned telecom. Largest in Singapore, second in Australia (Optus) and India (Bharti Airtel). Invests in 5G, cloud, and cybersecurity. | ||||||
Petronas | PETMK 3.50% 21 Apr 2030 | USY68856AT38 | USD 93.79 | 5.46 | 3.19 | -3.22 |
Malaysia’s fully government-owned national oil company, operating across the entire oil and gas value chain with strong state support, robust cash generation, and a globally diversified asset base. | ||||||
TSMC | TAISEM 4.125% | US872898AG66 | USD 97.73 | 5.09 | 2.32 | -1.90 |
Top semiconductor manufacturer with leading technologies like the first commercial extreme-ultraviolet lithography (EUV). | ||||||
Alibaba | BABA 4.875% | USG01719AK24 | USD 98.23 | 5.42 | 3.21 | -3.70 |
China’s largest e-commerce company with around 50% market share and a growing user base. Leading cloud provider in Asia Pacific. | ||||||
CNPC Global | CNPCCH 2% | XS2179918037 | USD 89.42 | 5.19 | 3.46 | -2.58 |
| China's government-owned largest oil and gas producer and supplier. One of the world's major oilfield service providers and a globally reputed contractor in engineering construction. | |||||
CNOOC FINANCE | CNOOC 2.875% | US12625GAF19 | USD 93.77 | 5.17 | 2.78 | -1.92 |
| China's state-owned and largest producer of offshore crude oil and natural gas. Known for its pioneering deepwater drilling capabilities. | |||||
Meituan
| MEITUA 4.625% 2 Oct 2029 | USG59669AF11 | USD 97.25 | 5.64 | 2.73 | -2.25 |
| Leading Chinese e-commerce platform for local services, offering a wide range of services such as food delivery, travel booking, and entertainment through its app. | |||||
JD.com
| JD 3.375% 14 Jan 2030 | US47215PAE60 | USD 94.31 | 5.30 | 3.00 | -2.59 |
One of China’s largest e-commerce platforms, focusing on high-quality, branded products, and in-house logistics, making it the leader in categories like electronics and home appliances. | ||||||
Xiaomi
| XIAOMI 3.375% 29 Apr 2030 | USY77108AA93 | USD 93.07 | 5.56 | 3.22 | -2.78 |
| Leading Chinese technology company that designs smartphones, smart devices, and IoT products, recently expanding into electric vehicles | |||||
SK Hynix
| HYUELE 4.375% 9 Nov 2030 | USY8085FBZ28 | USD 95.66 | 5.63 | 3.52 | -3.83 |
| SK Hynix is the world’s second-largest memory chipmaker and a key beneficiary of the global AI-driven demand for high-bandwidth memory. | |||||
Singapore Airlines
| SIASP 3.5% | SGXF10397887 | SGD 103.16 | 2.69 | 3.79 | -1.92 |
| Temasek-controlled, Singapore’s flag carrier with a young fleet and robust liquidity, benefitting from quasi-sovereign support. Operating a full-service carrier (SIA) and low-cost carrier (Scoot) across 130-plus destinations. | |||||
MPACT Treasury
| MCTSP 4.25% 29 Mar 2030 | SGXF59943971 | SGD 105.07 | 2.70 | 3.21 | -2.27 |
| Temasek-backed REIT, owning flagship VivoCity and diversified Grade-A assets across Singapore, Hong Kong and North Asia, providing resilient distributions with organic growth upside. | |||||
Starhub
| STHSP 2.48% 08 Jan 2031 | SGXF30667780 | SGD 98.64 | 2.82 | 3.97 | -1.49 |
| Integrated Singapore telco spanning mobile, broadband, pay-TV and enterprise-ICT services, leveraging 5G and digital platforms to stabilise cash flows and reignite growth. Majority-owned by ST Telemedia, a wholly owned Temasek portfolio company. | |||||
Source: Bloomberg. All prices and yields are indicative and for reference only. Please contact the UOB Kay Hian product team for more information.
US & Europe Non-Financials Corporates
Company | Bond Name | ISIN | Current Price (Oct 12) | YTM (%) | Duration (y) | 6M Performance (%) |
Microsoft | MSFT 1.35% | USU59340AK20 | USD 87.32 | 4.95 | 3.73 | -2.37 |
Big Tech leader with businesses in operating system, search engine, cloud computing, and artificial intelligence etc. A combination of stable cash flows and new growth opportunities. | ||||||
Meta | META 4.8% | US30303M8M79 | USD 98.29 | 5.33 | 3.19 | -3.57 |
Previously Facebook, the origin of today's social media trend. With a growing user base of nearly 4 billion (half of the world population). | ||||||
Nvidia
| NVDA 2.85% 01 Apr 2030 | US67066GAF19 | USD 92.12 | 5.37 | 3.23 | -3.11 |
A prominent chipmaker that designs graphics processing units (GPUs) for gaming and artificial intelligence. It held a dominant position in the graphics cards industry with an 80.2% market share in 2Q23. | ||||||
Costco | COST 1.6% | US22160KAP03 | USD 88.68 | 5.16 | 3.31 | -2.37 |
World's 3rd largest retailer which operates a chain of membership-only big-box warehouse club retail stores. | ||||||
Procter & Gamble | PG 4.35% | US742718GF07 | USD 98.73 | 4.94 | 2.14 | -2.40 |
Founded more than 180 years ago with operations in over 70 countries. Specialize in a wide range of personal health/consumer health, personal care, and hygiene products. | ||||||
Nestle | NESNVX 4.65% | USU6408XAK55 | USD 98.82 | 5.17 | 2.24 | -2.44 |
World's largest food and beverage company with over 2,000 brands and a presence in 188 countries. | ||||||
Pepsico | PEP 4.1% | US713448GL64 | USD 98.02 | 5.04 | 2.10 | -2.10 |
Second-largest food and beverage business in the world based on net revenue, profit, and market capitalization. | ||||||
Coca-Cola Co | KO 2.125% | US191216CM09 | USD 92.18 | 5.06 | 2.75 | -1.96 |
Distributes the world's best-selling soft drink in over 200 countries, outselling its nearest competitor Pepsi by a significant margin. | ||||||
Pfizer | PFE 3.45% | US717081ET61 | USD 96.3 | 5.09 | 2.28 | -2.10 |
Founded in the mid-19th century, American drug maker with a strong and diversified drug portfolio. Biggest pharmaceutical company in the world based on the 2022 revenue. | ||||||
BP Capital America | BPLN 3.723% | US05565QDH83 | USD 97.27 | 5.09 | 1.98 | -1.63 |
Key player in the oil and gas industry that operates in 70 countries. It produces 2.3 million barrels of oil equivalent per day in 2022. | ||||||
McDonald's Corp | MCD 4.8% | US58013MFU36 | USD 99.58 | 5.04 | 1.72 | -1.68 |
The biggest fast-food chain in the world operating in the US and internationally with over 40,000 restaurants worldwide. | ||||||
Walt Disney | DIS 7.625% | USU25497AU95 | USD 105.4 | 4.92 | 1.91 | -2.61 |
Founded in 1923, a leading entertainment and production company known for its iconic animated film theme parks, streaming services, and media networks, creating magical experiences for audiences worldwide. | ||||||
JOHNSON & JOHNSON | JNJ 4.9% | US478160CV47 | USD 98.92 | 5.16 | 4.02 | -4.52 |
Johnson & Johnson manufactures health care products and provides related services for the consumer, pharmaceutical, and medical devices and diagnostics markets. The Company sells products such as skin and hair care products, acetaminophen products, pharmaceuticals, diagnostic equipment, and surgical equipment in countries located around the world. | ||||||
Source: Bloomberg. All prices and yields are indicative and for reference only. Please contact the UOB Kay Hian product team for more information.
Global Financial Institutions
Company | Bond Name | ISIN | Current Price (Oct 12) | YTM (%) | Duration (y) | 6M Performance (%) |
JP Morgan | JPM 4.005% | US46647PAR73 | USD 100.68 | 4.75 | 2.73 | -1.92 |
a) Largest bank in the world by market cap b) CET1 (Common equity Tier 1) ratio at 14.3% in 1Q26. Down 0.2% from 4Q25. Attention: c) Senior Unsecured bond, with respect to the exercise of US bail-in power. d) Resettable features. | ||||||
Bank of America
| BAC 2.087% | US06051GJZ37 | USD 98.14 | 4.75 | 2.39 | -1.36 |
a) The 2nd largest bank, globally, majoring in commercial banking, wealth management and investment banking b) CET1 ratio at 11.2% in 1Q26. Down 0.2% from 4Q25. Attention: c) Senior Unsecured bond, with respect to the exercise of US bail-in power. d) Resettable features. | ||||||
UBS AG | UBS 5.428% | USH42097EV54 | USD 99.72 | 5.55 | 2.13 | -2.56 |
a) One of the most well-established and influential banks globally. Foremost bank in Switzerland, focusing on wealth management, asset management and investment banking. b) CET1 ratio at 14.7% in 1Q26. Up 0.3% from 4Q25. Attention: c) Senior Unsecured bond, with respect to the exercise of Swiss bail-in power. d) Resettable features. | ||||||
HSBC Holdings | HSBC 4.583% | US404280BT50 | USD 101.33 | 4.85 | 3.04 | -1.88 |
a) Bank giant with unique historical and business links to East Asia and a highly multinational footprint b) CET1 ratio at 14.0% in 1Q26. Down 0.9% from 4Q25. Attention: c) Senior Unsecured bond, with respect to the exercise of UK bail-in power. d) Resettable features. | ||||||
BNP Paribas | BNP 5.27% | FR001400JF24 | USD 101.23 | 4.88 | 3.04 | -1.61 |
a) Flagship bank in France, 2nd largest bank in Europe by asset. b) CET1 ratio at 12.8% in 1Q26. Up 0.2% from 4Q25. Attention: c) Senior Preferred bond, with respect to the exercise of France bail-in power. d) Resettable features. | ||||||
Standard Chartered
| STANLN 4.299% 13 Jan 2030 | XS3258535908 | USD 97.29 | 5.60 | 2.08 | -1.88 |
a) Prominent international banking group with a strong presence across Asia, Africa, and the Middle East. b) CET1 ratio at 13.4% in 1Q26. Down 0.7% from 4Q25. Attention: c) Senior Unsecured bond, with respect to the exercise of UK bail-in power. d) Resettable features | ||||||
National Australia Bank | NAB 4.308% 13 Jun 2028 | US632525CJ86 | AUD 98.42 | 5.07 | 3.31 | -0.37 |
a) Australia’s largest business bank (“Big Four”) b) CET1 ratio at 11.48% in 1Q26. Down 0.22% from 4Q25. Attention: c) Senior Unsecured bond | ||||||
FWD Group Holdings
| FWDGHD 7.784% 6 Dec 2033 | XS2730013104 | USD 108.02 | 6.37 | 5.37 | -6.02 |
Hong Kong–headquartered life insurer operating across 10 Asian markets, including Hong Kong, Singapore, Japan, Thailand, Indonesia, and the Philippines, serving over 34 million customers with diversified life, health, and general insurance products. | ||||||
Westpac Banking Corporation
| WSTP 5.151% 12 Feb 2031 | AU3CB0331148 | AUD 100.21 | 5.09 | 3.96 | n.a. |
a) Headquartered in Sydney and Australia’s oldest bank (“Big Four”) b) CET 1 ratio at 12.42% in 1H26. Up 0.18% yoy. Attention: c) Senior Unsecured bond | ||||||
Source: Bloomberg. All prices and yields are indicative and for reference only. Please contact the UOB Kay Hian product team for more information.
We also offer regular updates on selected bonds from the Bond Radar above. The month’s Bond Highlight is on:
META 4.8% 15 May 2030
About the Issuer
Meta Platforms (META) is a global technology leader operating Facebook, Instagram, WhatsApp and Messenger, with a dominant digital advertising business and significant investments in artificial intelligence (AI). As of October 9, 2026, META has an equity market capitalization of approximately USD 1.83tn. As of June 2026, the company held USD 90.26bn in cash, cash equivalents and marketable securities against USD 84bn in outstanding long-term debt, maintaining a modest net cash position despite its aggressive AI investment cycle. The company has USD 84bn of bonds outstanding, with an average maturity of 18.62 years and an average fixed coupon of 5.19% (Bloomberg).
Investment Thesis
- Dominant advertising franchise supports strong cash generation. Meta's advertising business remains its key credit strength, supported by approximately 3.60bn daily active users across its platforms. Revenue grew 28% yoy to USD 60.80bn in 2Q2026, driven by higher advertising impressions and pricing. Its established advertising ecosystem and ability to monetize user engagement provide a strong foundation for debt servicing.
- AI investments strengthen long-term competitiveness. Meta is integrating AI across advertising, content recommendations and consumer applications to improve user engagement and monetization. Management expects 2026 capital expenditure (capex) of USD 130–145bn, including finance lease principal payments, to support AI infrastructure and its core business. While the spending is substantial, successful AI adoption could strengthen advertising efficiency and create additional revenue opportunities over time.
- Heavy capex is increasingly weighing on free cash flow. Capex reached USD 31.08bn in 2Q2026, compared with USD 17.01bn a year earlier. Consequently, free cash flow (FCF) declined approximately 91% yoy to just USD 784mn, despite operating cash flow rising to USD 31.86bn. The sharp deterioration highlights the financial burden of AI infrastructure expansion and raises questions over the sustainability of spending at current levels.
- Strong balance sheet provides a buffer, but AI returns remain the key risk. Meta issued USD 25bn of senior unsecured bonds in May 2026, bringing total outstanding debt principal to USD 84bn. Nevertheless, its substantial liquidity and strong operating cash generation continue to support its credit profile. The main risks are prolonged negative or weak FCF, further debt-funded capex, uncertain returns on AI investments and potential regulatory or litigation-related costs. A sustained deterioration in these areas could gradually weaken its credit metrics.
Financial Highlights (2Q2026)
- Operating cash flow to interest expense: 40.69x. Strong operating cash generation provides substantial coverage of interest obligations, indicating comfortable debt-servicing capacity despite higher borrowing costs.
- Free cash flow (FCF) to total debt: 0.94%. The low quarterly ratio reflects the significant impact of AI infrastructure spending on cash flow. While FCF remains positive, continued heavy capex could weaken internal funding capacity and increase reliance on external financing.
- Net debt / EBITDA: -0.06x (Net cash). Meta maintains a modest net cash position of USD 6.60bn, supported by substantial liquidity and strong earnings. While leverage remains manageable, sustained AI spending and further debt issuance could gradually weaken its balance sheet.
- Current ratio: 2.23x. Current assets remain comfortably above current liabilities, indicating healthy near-term liquidity and sufficient resources to meet short-term obligations.
- Operating margin: 31%. Although profitability remains healthy, the margin declined from 43% a year earlier, reflecting higher operating expenses, including AI-related spending, litigation charges and restructuring costs. Sustaining profitability while scaling AI investments will be important for Meta's longer-term credit strength.
Macro Comments
We track the following US economic data to understand the Fed policy and interest rate changes. We then selectively comment on a few of the indicators, those that we deem the most relevant.
Inflation | Consumption | Production | Labor Market | GDP | Fed |
CPI & Core CPI | Consumer Sentiment Index | Manufacturing PMI | Jobless Claims | GDP | FOMC meeting |
PPI & Core PPI | Consumer Credit | Services PMI | Job Openings | GDPNow (est.) | Fed Speeches |
PCE & Core PCE | PCE Consumption | New Orders | Non-farm Payroll |
| FedWatch |
| Retail Sales | Freight Index | Unemployment |
| Prediction Market |
|
|
| Wage Growth |
| FOMC meeting |
Key Conclusion: September saw a whipsaw repricing of Fed policy expectations, evidenced by a sharp drop in October rate hike odds in just one week. This dramatic change reinforces our Fed Wildcard view, with continued uncertainty in policy rates and wild swings in rate expectations. Adding to the uncertainty, the recent diesel-price spike deserves close monitoring, as it could reinforce inflation stickiness and keep the Fed hawkish for longer.
- Fed policy (Oct FOMC). Following the Fed’s first rate hike in more than three years, the market’s debate has shifted to the timing of the next hike. The Fed Wildcard was on full display in September, as the probability of an October hike plunged from 70% to 22% in just one week. This repricing was driven by a combination of cumulative data and FOMC member speeches, as Chair Warsh refrained from public communication between Fed meetings. The sharp drop in hike odds triggered a dramatic rally in the 2-to-5-year sector (prices up, yields down), while long-term yields remained elevated amid separate challenges (see Hot Topics below) – resulting in the yield curve steepening.
Rate hike timeline shifts constantly, echoing our Fed Wildcard
Source: Bloomberg, FedWatch
- Labor Market (Sep Non-farm Payroll). September’s employment report was a clear miss, with payrolls increasing by only 29K, well below the 70K consensus. The print was partially distorted by a late Labor Day holiday, with job gains highly concentrated in healthcare, construction, and AI-supported durable goods. Meanwhile, both August and July numbers have been revised lower, taking the three-month average payroll growth to 51K – the breakeven level to hold the unemployment rate steady. Indeed, unemployment edged up only 0.03ppt to 4.18% while the labor force participation rate rose just 0.2ppt to 61.8%.
- Production (Sep PMI). In stark contrast to labour market weakness, US ISM Services PMI rose to a five-year high of 58.4 in September, defying market expectations of a slowdown. The internals seem robust, with strong new orders, business activity, and employment components. The divergence between a weakening jobs market and a booming services sector is a key puzzle for the Fed currently. Services, which account for the bulk of US employment, are clearly not rolling over. The services strength complicates any dovish narrative and is perhaps the primary reason keeping the Fed from pivoting to rate cuts.
- Inflation (Aug PCE and BEA methodology change). The August PCE report was benign on the surface, with core inflation up 3.0% vs. the expected 3.3%. However, August’s PCE data require careful reassessment in light of a revision to the Bureau of Economic Analysis (BEA) methodology. In short, BEA recently changed seasonal adjustment factors and updated its weighting methodology, leading to a slight downward bias in recent prints. This technical recalibration ultimately works in favor of the Fed holding rates, as it removes the artificial upward pressure that had previously emboldened the Fed's hawkish camp.
- Diesel is now a key inflation bellwether. Amid the second wave of rising energy price since July, diesel prices have increased significantly faster than gasoline, reflecting tighter middle-distillate supply alongside resilient US PMIs. Higher diesel prices can quickly feed into freight, logistics and input costs, creating broader inflationary pressure than gasoline. If sustained, the diesel spike could reinforce inflation stickiness and keep the Fed hawkish for longer. We are watching this closely.
Rallying diesel price (above the 2022 peak) is a key thing to watch for inflation outlook
Source: Bloomberg, Goldman Sachs Research
Hot Topic: Unpacking the Long-term Yield Surge – Why Higher for Longer
US Treasury Yields 1-month Movement
Source: UOB Kay Hian, Bloomberg, as of Oct 12, 2026
In our June 2026 Fixed Income Monthly, we explicitly warned that the 10-year Treasury yield may trade at a new norm of above 4.5%. That prediction has been spot-on, and our “higher-for-longer” view on long-term yields remains intact. Let’s revisit both macro and micro forces behind the current surge in yields, and see whether this trend is likely to continue.
- Higher inflation expectations. Energy market pressures (elevated oil prices) and broadening core price stickiness (from services to rents etc.) have kept inflation expectations above the Fed’s 2% target, limiting the scope for markets to pricing in future monetary easing. Result: higher long-term yields.
- Stronger growth expectations. Despite a K-shaped bifurcation, the US economy remains surprisingly strong, supported by resilient consumer spending, private investment (AI capex) and robust corporate earnings. Such strength keeps real growth expectations firm and further delays any expectations for rate cuts. Result: higher long-term yields.
- Rising term premium. Structural deficits are expanding in the US and other developed countries (see below). A populism shift along with election season dynamics could increase federal spending and further worsen the US debt burden. Rising fiscal concerns are lifting the term premium, as investors demand greater compensation for holding long-duration Treasuries. Result: higher long-term yields.
- Crowding out from AI-driven debt supply. Staggering AI capex is driving massive long-dated corporate debt issuance, which is flooding the market, competing for investor capital and adding upward pressure on government bond yields. Please see the US Credit section below for more information. Result: higher long-term yields.
All four forces above are unlikely to reverse in the near term, keeping long-term yields higher for longer. We hereby reiterate our June view that the new floor for 10-year yields sits at around 4.5%, while the top of the range remains difficult to gauge (the latest peak was 5.34%).
Therefore, we maintain our Core Recommendation on short-duration (< 3 years), top-rated (A and above), investment-grade bonds. We suggest investors avoid aggressively adding duration until a clearer trading range for long-term yields is established.
Hot Topic: Europe the Next Pressure Point
The upward pressure on long-term yields is not confined to the US, as sovereign yields are also surging globally (see chart below). Europe, in particular, has re-emerged as a key pressure point, highlighted by escalating fiscal strains in France. France’s 10-year borrowing costs have risen toward 5% (highest since 2002), with a budget deficit second only to the US. With over USD 1 trillion in French debt coming due by 2030 and record bond sales looming, investors are demanding greater compensation for taking French sovereign risk, reinforcing our view that "higher-for-longer" is a global phenomenon.
Is another Euro debt crisis brewing? Our research partner Longview Economics thinks the warning signs are flashing, with sovereign spreads widening, liquidity tightening and fiscal concerns resurfacing. Stress could intensify before policymakers step in, meaning things could get worse before they get better. Against this backdrop, Europe is emerging as pressure point that we need to monitor closely, but it is too early to call a full-blown crisis.
Long-term bond yields are rising globally, alongside structural fiscal expansions worldwide
Source: Bloomberg
Credit View
US Credit: Crowding Out from AI-Driven Debt Supply
US corporate bonds continue to offer attractive yields, but record AI financing is increasing the amount of debt investors need to absorb – potentially crowding out demand for both Treasuries and other corporate bonds. That, in essence, is AI crowding-out argument.
- AI financing remains a multi-year theme for fixed income, despite a relatively quiet September. Morgan Stanley estimates global AI-related debt issuance of USD 466bn through September, compared with USD 216bn in all of 2025. The MS classification recorded no US investment-grade AI issuance in September. Goldman Sachs also believes much of this year’s funding by hyperscalers and other Big Tech issuers is largely complete. However, future borrowing could rise as data centre projects progress. Goldman highlights estimated financial commitments of USD 2.8tn across leases, guarantees and purchase obligations. These commitments are separate from outstanding bond debt, but they are still important considerations in credit analysis.
- New AI bonds could crowd out long-term Treasuries by competing for investor capital. Insurers, pension funds and tactical traders may choose high-quality corporate bonds for the yield pick-up over government debt. Goldman Sachs noted that parts of the corporate bond market increasingly trade like rates products, helping explain the growing overlap between Treasuries and IG corporate bonds. A significant share of new corporate bond issuance is now related to AI, meaning AI financing may increasingly compete with US Treasuries for investor demand. Therefore, it is not far fetched to say that AI is contributing to rising 10-year yields.
- The same crowding-out effect extends to other corporate bonds, with major implications for market structure, sector concentration and credit spreads etc. So far, the impact of AI financing on credit spreads appears limited, likely supported by a resilient US economy. But this does not mean the risk should be dismissed. Morgan Stanley’s September-end data show IG spreads of about 80bps and an average yield-to-worst of 6.0%, while HY spreads stood at 311bps. Goldman Sachs estimates that spreads account for less than 15% of IG yields as of October. However, Goldman also warns that sharp swings in interest rates could make investors more cautious, prompting spreads to widen.
- AI or not, bond issuance remains strong across the board. JPMorgan reports USD 197bn of US high-grade issuance in September, resulting in a record USD 503bn in 2Q and bringing the YTD total to USD 1.69tn +30% yoy. Financial institutions issued USD 86bn in September, while acquisition financing contributed USD 61bn across sectors. Meanwhile, investors received cash from maturing bonds and coupon payments – available for reinvestment. After these payments, JPMorgan puts September’s additional supply at just USD 40bn. This helps explain why heavy issuance has yet to materially widen spreads.
- Wall Street’s sector recommendations. Goldman Sachs prefers select BBB bonds over higher-rated AA and A papers for their additional spread, and sees banks, energy and healthcare as sectors to diversify away from AI. Morgan Stanley favours strong hyperscalers and completed infrastructure with reliable tenants and clear creditor protections. For project debt, construction delays, access to power and guarantees warrant close attention. In any case, expect further spread volatility before December, although slower year-end issuance could later provide some support. Selection should therefore balance credit strength, interest-rate sensitivity and future funding needs.
Single-A US Corp Effective Yield vs 5 year Breakeven Inflation Rate
Source: https://fred.stlouisfed.org
Notes:
ICE BofA Single-A US Corporate Index Effective Yield: based on a subset of the ICE BofA US Corporate Master Index, i.e. all securities with the investment grade rating A. 5-Year Breakeven Inflation Rate: The breakeven inflation rate represents a measure of expected inflation derived from 5-Year Treasury Constant Maturity Securities (BC_5YEAR) and 5-Year Treasury Inflation-Indexed Constant Maturity Securities (TC_5YEAR). The latest value implies what market participants expect inflation to be in the next 5 years, on average. Starting with the update on June 21, 2019, the Treasury bond data used in calculating interest rate spreads is obtained directly from the U.S. Treasury Department.
Asia Credit: Unique Opportunities Beyond AI
- AI financing in Asia is modest relative to the US, reflecting fewer and smaller hyperscalers, lower AI capex, limited financial resources and the US tech sanctions on China – which restricts access to advanced AI chips. There is also a structural reason: There are many Asian firms in the global AI supply chain – such as TSMC, SK Hynix and Samsung – that are getting paid for the AI buildout rather than paying for it.
- The AI investment cycle is indeed improving the credit outlook for select Asian technology suppliers. Bloomberg Intelligence identifies around USD 24bn of bonds with potential for rating upgrades, led by TSMC, SK Hynix and Kioxia (candidates, not yet confirmed). TSMC benefits from its lead in advanced chips and strong cash generation, although its overseas factory expansion carries execution risk. SK Hynix and Kioxia are riding on the AI-driven Memory Supercycle, with sustainable earnings growth for industry leaders, in our view. Meanwhile, Bloomberg sees less immediate upgrade potential for Xiaomi because of higher component costs and electric-vehicle losses, and holds the same view for Hon Hai due to its heavy investment using cash.
Beyond AI, there is plenty happening across Asia’s credit markets, which makes the region a dynamic source of diversification.
- Singapore banks remain well supported by strong capital buffers. Bloomberg Intelligence reports common equity tier 1 ratios of 14.6% / 14.0% / 15.0% for DBS, OCBC and UOB respectively, on a fully phased-in basis. Their securities holdings and interest-rate hedges should help limit the impact from rising bond yields. Separately, JPMorgan expects limited credit spread disruption from the proposed total loss-absorbing capacity framework, which requires eligible capital and debt equal to 14% of risk-weighted assets. Banks have five years to comply after formal notification, allowing them to pace new borrowing over time. Final rules are still pending, and not all existing capital qualifies.
- Funding is still needed yet differs across Singaporean banks. Bloomberg estimates a larger shortfall in eligible loss-absorbing funding at DBS than peers. Pricing matters: JPMorgan is cautious on the relative value of DBS’s AUD 2031 bond, offered at 59 basis points above the swap benchmark and a 5.6% yield. The concern is valuation, rather than a deterioration in DBS’s credit standing. A strong issuer can remain financially sound while offering too little additional yield compared with alternatives.
- Favouring Malaysian banks with stable funding and adequate capital. Malaysian banks are seeing stronger lending demand, including data-centre financing, but deposits also need to keep pace. Bloomberg reports August loan growth of 5.7% yoy against deposit growth of 5.2%. Three-month KLIBOR, an interbank funding benchmark, rose to 3.55% on October 6 from 3.28% at the start of the year. Higher funding costs can reduce banks’ net interest margin, yet Maybank’s larger low-cost deposit base provides some protection. We favour banks with stable funding and adequate capital, alongside technology companies with sustained cash flows. Bond selection should also account for valuation, liquidity and refinancing needs.
- Selectivity remains key in CNH bonds. The offshore renminbi (CNH) bond market is growing and attracting a wider range of issuers. JPMorgan’s August analysis puts outstanding credit bonds at RMB 1.14tn (USD 170bn), more than four times the 2021 level. More offshore renminbi cash and Southbound Bond Connect flows have supported demand, while borrowers are issuing across more sectors and longer maturities. However, growth does not make every CNH bond good value. JPMorgan finds that, after swapping yields into USD, the CNH index offers around 80 basis points less yield on average than USD peers. Selected companies, non-bank financials and longer-dated non-Chinese issuers still offer opportunities. Comparisons should include currency-hedging costs, maturity and ease of trading.
In summary, Asian credit continues to offer attractive income and differentiated opportunities, supported by AI capex beneficiaries, high-quality banks and select CNH bonds.
Asia Pacific Key Sovereign Rates Monitor
Region | 2 Year | 5 Year | 10 Year | 30 Year |
Australia | 4.91 | 4.98 | 5.33 | 5.79 |
China | 1.23 | 1.38 | 1.67 | 2.09 |
China (USD) | NA | NA | NA | NA |
India | 6.72 | 6.93 | 7.30 | 7.72 |
Indonesia | NA | 6.98 | 7.16 | 7.21 |
Indonesia (USD) | 5.08 | 5.61 | 6.19 | 6.41 |
Japan | 1.90 | 2.33 | 3.00 | 4.05 |
Malaysia | NA | 3.62 | 3.93 | 4.40 |
New Zealand | 3.81 | 4.46 | 5.03 | 5.58 |
Pakistan | NA | 12.18 | 12.57 | NA |
Philippines | 6.54 | 7.54 | 7.76 | NA |
Philippines (USD) | 4.86 | 5.59 | 6.22 | NA |
Singapore | 1.89 | 2.18 | 2.42 | 2.49 |
South Korea | 3.90 | 4.16 | 4.40 | NA |
South Korea (USD) | 4.22 | 4.37 | NA | NA |
Taiwan | 1.65 | 1.77 | 1.86 | 2.25 |
Thailand | 1.23 | 1.70 | 2.31 | 3.25 |
Source: Bloomberg, as of Oct 12, 2026
Credit Spreads
Source: Bloomberg
Asia IG Spread: Bloomberg EM Asia USD Credit High Grade Average OAS (BEUGOAS)
US IG Spread: ICE BofA Single-A US Corporate Index Option-Adjusted Spread (BAMLC0A3CA)
Source: Bloomberg
Asia HY spread: Bloomberg Asia USD High Yield Bond Index Average OAS (BAHYOAS)
US HY Spread: Bloomberg US Corporate High Yield Average OAS (LF98OAS)
Credit Yields
Source: Bloomberg
Asia IG YTW: Bloomberg Asia Ex-Japan USD Credit Corporate IG (I29385)
US IG YTW: S&P US Investment Grade Corporate Bond Index Yield to Worst (SPUIGBDW)
Source: Bloomberg
Asia HY YTW: Bloomberg Asia USD High Yield Bond Index Yield to Worst (BAHYYW)
US HY YTW: S&P US High Yield Corporate Bond Index Yield to Worst (SPUHYBDW)
Bond ETF and Fund Radar
Key Risks for Investing in Bond Funds
- Market risk: Bond prices can fall due to rising interest rates, widening credit spreads, economic slowdowns, or issuer-specific issues.
- Currency risk: FX movements can significantly affect returns.
o Stronger USD boosts unhedged foreign holdings in SGD terms.
o Weaker USD can offset or even reverse bond gains.
- Hedged share classes: Many funds offer SGD, EUR, AUD, HKD, or CNH-hedged classes to reduce FX volatility and focus on credit and duration exposure.
High-Yield Exposure
- Global bond funds may hold both investment-grade and high-yield bonds.
- High-yield bonds carry higher default, macro, and liquidity risks.
- This means greater price volatility and potential capital losses, especially if the exposure is unhedged in a weakening currency.
Key Considerations
- Past performance is not indicative of future results.
- Yield alone should not drive investment decisions.
- If diversifying away from USD amid de-dollarisation trends, compare:
o Hedged share classes
o Hedging costs
o Overall risk–return profile
Bond ETF and Fund Radar: Key Facts
Name | Category | Duration Type | Expense | Effective Duration | Average Yield | Credit Quality |
Vanguard Short-Term Corporate Bond ETF (VCSH US) | Investment Grade ETF | Short | 0.03% | 2.7 | 5.50% | 55.06% in A rated and above 44.86% in BBB rated Average Quality – A- |
iShares Core U.S. Aggregate Bond ETF (AGG US) | Investment Grade ETF | Intermediate | 0.03% | 5.69 | 5.48% | 87.64% in A rated and above 11.54% in BBB rated Average Quality – AA |
iShares iBoxx $ Investment Grade Corporate Bond ETF (LQD US) | Investment Grade ETF | Long | 0.14% | 7.53 | 6.11% | 58.79% in A rated and above 40.23% in BBB rated Average Quality – A- |
HSBC Short Duration Bond Fund | Investment Grade UT | Short | 0.70% | 2.45 | 5.35% | 42.12% in A rated and above 44.92% in BBB rated 10.01% in HY Average Quality – A-/BBB+ |
PIMCO GIS Income Fund | Investment Grade UT | Intermediate | 1.45% | 7.36 | 8.37% | 79.20% in A rated and above 11.20% in BBB 9.50% in HY Average Quality – AA- |
Fidelity US Dollar Bond Fund | Investment Grade UT | Long | 1.03% | 6.3 | 4.98% | 81.47% in A rated and above 13.07% in BBB 1.79% in HY Average Quality – AA- |
Source: Bloomberg, MorningStar, iShares and Vanguard as of Oct 12, 2026. US listed ETFs might subject investors to a 30% withholding tax on all dividends received. Please consult your tax consultant for further information.
Bond ETF and Fund Radar (continued): Performance Data
Fund Name | ISIN / Ticker | Currency | 1 Month Total Return (%) | YTD Total | 1 Year Total Return (%) |
HSBC GIF Global Short Duration Bond Fund | LU1163226092 | USD | -0.10 | 1.14 | 2.05 |
LU1272399756 | SGD | -0.30 | -0.88 | -0.65 | |
LU2639850283 | EUR | -0.22 | -0.22 | 0.19 | |
PIMCO GIS Income Fund | IE00B7KFL990 | USD | -1.76 | -2.92 | -1.14 |
IE00B9HH6X13 | SGD | -1.94 | -4.88 | -3.78 | |
IE00B84J9L26 | EUR | -1.85 | -4.23 | -2.95 | |
Fidelity Funds - US Dollar Bond Fund | LU0261947682 | USD | -1.35 | -3.78 | -3.52 |
LU2605879787 | SGD | -1.49 | -5.72 | -6.06 | |
LU2730164063 | EUR | -1.53 | -5.12 | -5.31 | |
Vanguard Short-Term Corporate Bond ETF (VCSH US) | VCSH US | USD | -0.16 | 0.25 | 1.35 |
iShares Core U.S. Aggregate Bond ETF (AGG US) | AGG US | USD | -1.10 | -2.38 | -1.96 |
iShares iBoxx $ Investment Grade Corporate Bond ETF (LQD US) | LQD US | USD | -1.41 | -3.73 | -3.65 |
Bloomberg US Aggregate Total Return Index | LBUSTRUU Index | USD | -1.07 | -2.48 | -1.98 |
Source: Bloomberg as of Oct 12, 2026. Based on the accumulative share class for unit trust (no fund dividends) and dividend reinvestment for ETF.
Investment Grade Bond ETF and Fund 6 Month Performance (Apr 12 to Oct 12, 2026)
Source: Bloomberg
Notes: This represents the performance of fund NAV in the specific time period. The performance is affected by the coupon received, dividend paid (if applicable), mark to market prices of the bond holdings and management fees, etc. The unit trusts selected are accumulative share class, ie no dividends.
Glossary
Average Coupon: the weighted average of the various coupons of a bond portfolio.
Average Credit Quality: the weighted average of each bond’s credit rating in a portfolio. See Average Rating below.
Average Duration: the sensitivity of the value of a bond portfolio to interest rate changes. The longer the duration, the more sensitive toward interest rate changes.
Average Rating: the weighted average rating of all bonds in a portfolio. For example, a portfolio with 25% in AAA, 25% in BBB and 50% CCC bonds would have a weighted average credit rating of B+, which is between BBB and CCC.
Average Yield To Maturity: the rate of return required for the present value of all the future cash flows of a bond portfolio to equal the current bond price.
Yield To Worst (YTW): a measure of the lowest possible yield on a bond that fully operates within the terms of its contract without defaulting. It is based on the earliest call or retirement date, assuming that a prepayment of principal occurs if a bond issuer uses the call option.
Effective Duration: see Average Duration above.
Effective Maturity: the date used in place of the final maturity for bonds with call, put or prepayment features.
Running Yield: coupon divided by a bond portfolio’s market price. This is different from Yield to Maturity as the Running Yield does not take into account if the bond market price is below or above Maturity redemption value.
Analyst
Qi Wang, CFA
qi.wang@uobkh.comAnalyst
Wendy Chen
wendy.chen@uobkh.comAnalyst
Benjamin Tan
benjamintan@uobkh.comDisclosures and disclaimers
This report is provided subject to, and must be read together with, the full Disclosures / Disclaimers available at this link, which are incorporated by reference into this report. In particular, this report is intended for general circulation and informational purposes only and does not constitute personal investment advice or a recommendation to buy or sell any investment product or security. You should independently evaluate the information and, where necessary, seek advice from a qualified financial adviser regarding the suitability of any investment. Analyst certifications required under applicable regulations, including SEC Regulation AC (where relevant), are included in this report. By accessing, receiving or using this report, you acknowledge that you have read, understood and agreed to be bound by the Disclosures / Disclaimers, as may be amended, supplemented or updated from time to time.


