

CIO Summary
Three layers of the Fed Wildcard. In this report, and for the first time, we clarified the three layers of the Fed Wildcard – each representing a specific source of uncertainty and a different time frame. We are short-term bearish, medium-term cautious and long-term bullish.
Our All ETF Model Portfolio for global asset allocation gained 2.0% in August and returned 6.7% YTD. The Energy Select ETF (XLE) and Emerging Markets ex-China (EMXC) were the largest contributors, while Industrials (XLI) and the Hang Seng Index ETF (2800.HK) were the biggest detractors.
Our US Stock Model Portfolio gained 1.8% in August and returned 8.7% YTD. Top 3 performers: LITE +28.1%, SKHY +14.5% and SNOW +13.0%.
Our China Stock Model Portfolio dropped 0.2% in August and lost 3.8% YTD. Top 3 performers: 2899.HK +10.2%, 883.HK +6.2% and 3986.HK +5.9%.
Fixed income: maintain our Core Recommendation on high-quality, investment-grade bonds with short durations (< 3 years).
Commodities: Continued central bank buying provides long-term support, reinforcing gold (2840.HK or GLD) as a top beneficiary of de-dollarisation.
Core Views and Recommendations
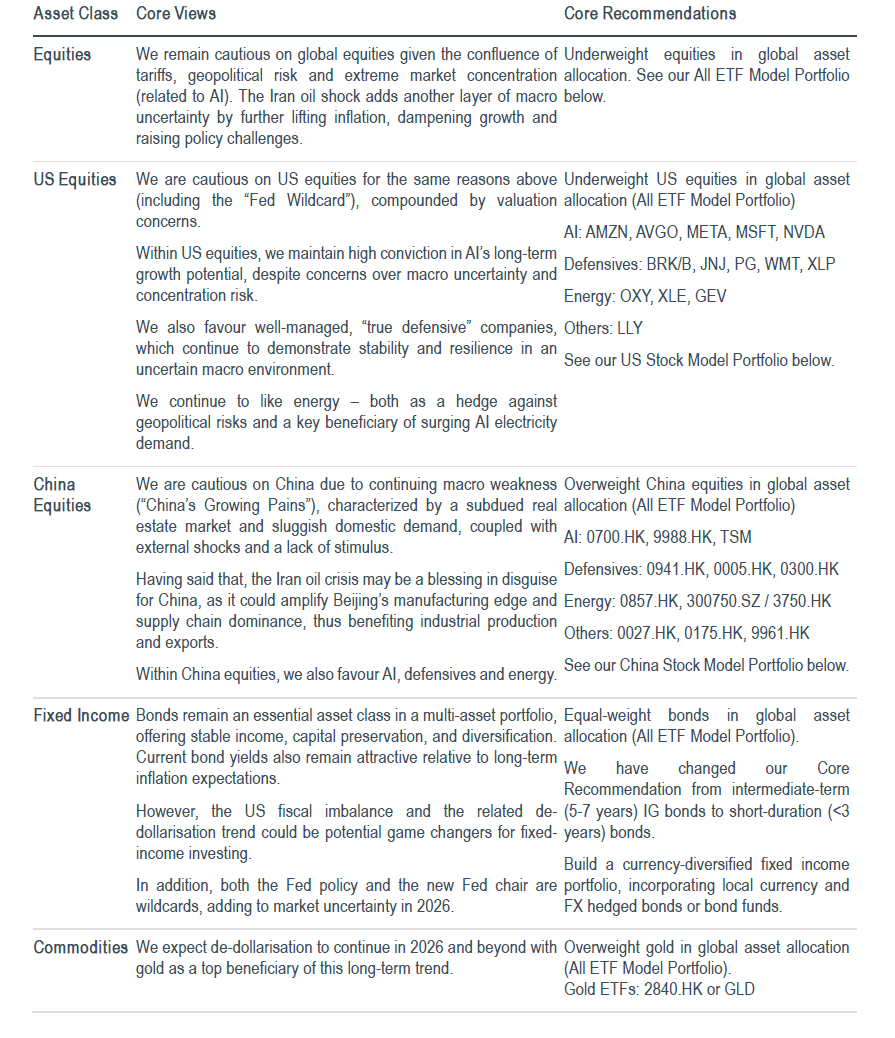
CIO Commentary
We've been absolutely right about "the Fed Wildcard" – one of our top predictions for 2026. The “Two Drunken Sailors” analogy refers to an additional layer of uncertainty beyond the traditional hawkish versus dovish debate. Below are the three layers of the “Fed Wildcard” that we see right now.
Layer 1: the Surface Story. The usual debate over whether the Fed is leaning hawkish (raising rates) or dovish (cutting rates) is important but could be superficial. Based solely on macro data and FOMC statements, markets can often fall into “false hawkishness" or “false dovishness”. Such misinterpretations can be traced back to mixed or conflicting data, and the lack of clear Fed guidance since new Chair Kevin Warsh took office. This narrative is somewhat superficial, not only because expectations for rate hikes can shift rapidly (doubling overnight), but also because additional factors (layers) can interfere with and even alter the Fed policy trajectory, triggering surprising market reactions. This helps explain why the stock markets could go up on hawkish data or signals in recent weeks, and vice versa.
Layer 2: the Deeper Problem. A new and deeper problem today is that the Fed and the Treasury seem to be pulling in different directions. For example, Treasury Secretary Scott Bessent is trying to push long-term yields down by doubling long bond buybacks and issuing more short-term bills. Meanwhile, the new Fed has signalled plans to reduce its USD 7 trillion balance sheet by moving away from long bonds and possibly raise (short-term) rates this year. More information on
Fed vs. Treasury: Two Drunken Sailors tied by a Tether can be found in the Fixed Income section below or our latest Fixed Income Monthly (Professional Investors only)
Layer 3: the Real Deal. Beyond the current conflict and confusion, the long-term outlook could be quite positive. This is because we may have the most technologically informed and innovation-friendly Fed Chair in history. Warsh has spoken publicly on several occasions about AI’s potential economic benefits: boosting productivity and helping contain inflation. If these productivity gains materialise, we believe AI could reduce the need for frequent Fed policy adjustments and further dampen market volatility. That is a big “if”, however, as AI has been more inflationary than deflationary so far.
Call to Action
Don’t just focus on rate hikes or rate cuts alone, even though they often drive short-term market volatility. Pay close attention to bigger issues that could influence the medium-to-long-term Fed policy. Given current constraints, the Fed can be neither too hawkish nor too dovish, creating trading opportunities when markets take on extreme views. We will keep you informed when such opportunities arise.
Stay invested in AI. AI is long-term positive for the economy and financial markets, and top-down macro risks do not justify giving up on AI investments. Some investors tend to sell all AI stocks when macro goes the wrong way and panic sets in, leading to significant market timing risk. We advise clients to stay invested in a diversified portfolio of AI + defensive stocks (our Barbell Strategy), while managing equity exposures accordingly based on fundamentals and valuation.
As a reference, we currently have around 34% invested in AI (with a focus on AI hardware), 24% in defensives, 10% in energy and others and 26% cash in our US Stock Model Portfolios. Our China Stock Model Portfolio is constructed along similar lines. More information can be found in the Equity section below.
Asset Allocation (All ETF Model Portfolio)
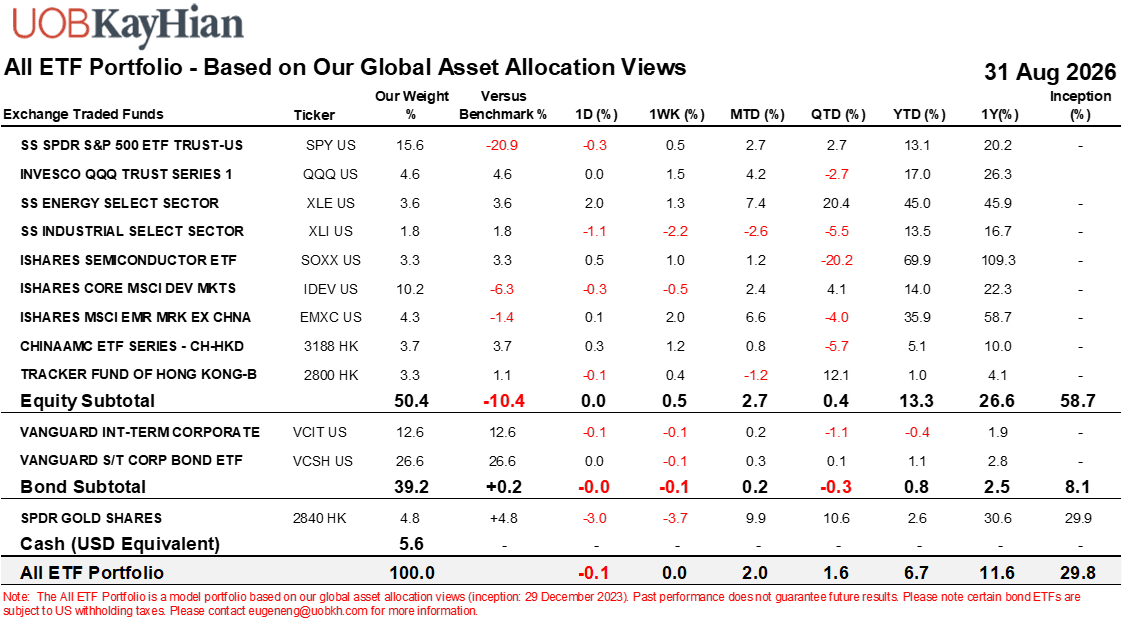
Source: UOB Kay Hian and Bloomberg. As of August 31, 2026.
Our All ETF Portfolio for global asset allocation was +2.0% in August and +6.7% YTD. The Energy Sector ETF (XLE) and Emerging Markets ex-China (EMXC) were the strong performers, +7.4% and +6.6% respectively. Meanwhile, Industrials (XLI) and the Hang Seng Index ETF (2800.HK) were the biggest detractors, -2.6% and -1.2% respectively.
US equity UNDERWEIGHT (28.9% vs. 36.1%). In August, we took profits in Energy (XLE) following another sharp spike in oil prices amid renewed US-Iran tensions. We also locked in some gains in the Semiconductor Sector ETF (SOXX) following its recent rebound.
Developed Markets ex-US UNDERWEIGHT (10.2% vs. 16.4%). DM ex-US (IDEV) gained 2.4% in August, driven mainly by Japan’s recovery as related to the semiconductor rebound. Similar to S&P 500, IDEV remained up low double digits YTD.
Emerging Markets ex-China UNDERWEIGHT (4.3% vs. 5.6%). EM ex-China (EMXC) rose 6.6% in August, fuelled by a sharp rebound in Korea (also AI and semis-related). EMXC remained up 36% YTD, making it one of the best performing regions globally.
China equity OVERWEIGHT (7.0% vs. 2.2%). The Hang Seng Index ETF (2800.HK) declined 1.2% in August after a strong rally in July, while China’s CSI 300 ETF gained only 0.8% – both related to China’s Growing Pains and the lack of major stimulus.
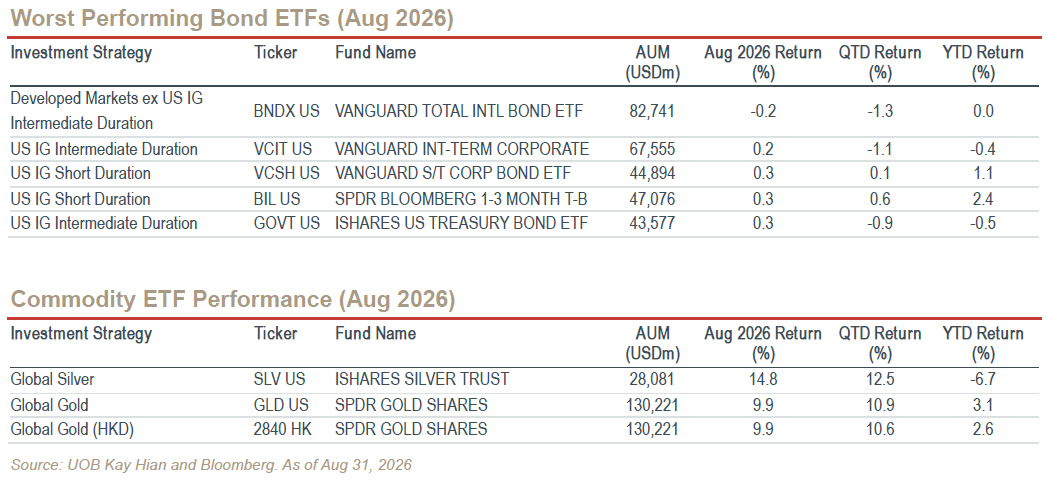
Fixed income EQUAL-WEIGHT (39.2% vs. 39.0%). Fixed income was gained just 0.2% in August as the Treasury market struggled to stabilise amid government intervention and the Fed Wildcard. The Intermediate-term Corporate Bond ETF (VCIT) rose 0.2% in August yet remained down 0.4% YTD, while the Short-term Corporate Bond ETF (VCSH) rose 0.3% last month and remained up 1.1% YTD. This continues to reinforce our Core Recommendation to stay short-duration in today’s uncertain rate environment.
Gold OVERWEIGHT (4.8% vs. 0.0%). We took profits in Gold (2840 HK) following a nearly 10% rally in August. We view gold as a key beneficiary and a long-term hedge against geopolitical risk, currency volatility and de-dollarisation. However, given its strong gains in recent years and the Fed Wildcard, we intend to trade part of our gold position opportunistically within a preset range.
Equities
US Equities
August was a month of relief and rotation, validating our "constructive short-term outlook" stated last month. Following severe deleveraging in July, the S&P 500 rallied 3.4% in August, while the Nasdaq rebounded 4.1%. The previous panic in semiconductors, especially memory stocks, began to gradually subside, as AI fundamentals remained intact and the technical tape improved.
However, September is historically a bumpy month for US equities, not to mention our thesis of a potential “Sep-Oct market awakening”.
Jackson Hole and macro data triggered a sharp increase in rate hike expectations. Chair Warsh’s hawkish speech, blowout labour data and hotter-than-expected CPI inflation led to a dramatic increase in FedWatch rate hike probabilities, from 30% a month ago to 85% today for a September hike. The front-end is now pricing in undue hawkishness while the long-end continues to reach new highs (10-year Treasury yield approaching 5%), reflecting market concerns over sticky inflation.
The Fed Wildcard is evolving into multiple layers of complexity and uncertainty, beyond the traditional hawkish vs dovish debate. Please see our CIO Commentary on page 4 for details.
AI fundamentals remain intact. Despite a long list of macro worries, industry data points have yet to point to any deterioration in AI fundamentals. GPU rental prices continue to surge 50%-60% over the past seven months, while Meta, Google and Amazon all raised their full-year capex guidance during the 2Q results season, among other supportive evidence.
Broad earnings fundamentals are intact. Beyond AI, the broader earnings backdrop remains remarkably robust: 86% of S&P 500 companies that reported 2Q earnings have beaten estimates, resulting in a staggering 47% yoy increase in EPS – up from 27% growth in 1Q. As a result, Wall Street has lifted full year earnings growth estimates for S&P 500 and Nasdaq to 29.3% and 46.1%, respectively.
Potential credit market headwinds. While AI and tech equity risks are mainly illusory, the credit market could face some AI-related headwinds, with hyperscaler CDS spreads skyrocketing and potential spillovers to other markets. Refer to our Fixed Income section below for more information.
Caution warranted into Sep-Oct. From now until the midterm elections in early November, we advise investors to remain cautious given the risk of a potential awakening, as markets begin to reprice a series of macro uncertainties, including but not limited to geopolitical risks, oil driven-inflation concerns, the Fed Wildcard and domestic political turmoil etc. No need to panic. Just stick to our Barbell Strategy of AI + defensives (see below).
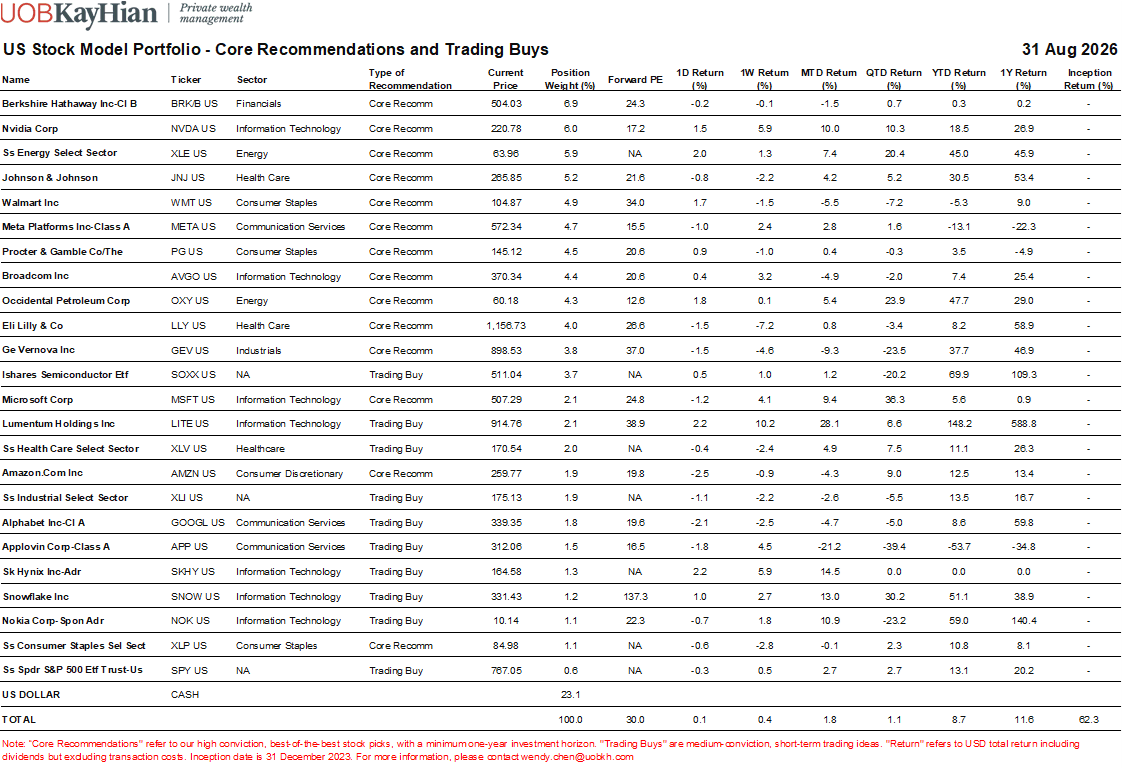
Source: UOB Kay Hian and Bloomberg. As of August 31, 2026.
Our US Stock Model Portfolio gained 1.8% in August and returned 8.7% YTD, underperforming S&P 500 (SPY) – which rose 2.7% in August and was up 13.1% YTD. The August lag was driven by Industrials (GEV -9.3%, XLI -2.6%), Communication Services (APP -21.2%, GOOGL -4.7%), Consumer Discretionary (AMZN -4.3%) and Consumer Staples (WMT -5.5%). This was partly offset by gains in Energy (OXY +5.4%, XLE +7.4%), Technology (NVDA +10.0%, NOK +10.9%, LITE +28.1%, SNOW +13%, SKHY +14.5%, MSFT +9.4%) and Healthcare (JNJ +4.2%, XLV+4.9%).
Cash rose to 23.1% at August-end, as we sold stocks to prepare for the Sep-Oct market awakening. We took profits in GOOGL, AMZN, AVGO, SOXX, SKHY and OXY, as well as trimming LITE, XLE, AMZN and XLP.
Top 3 performers: LITE +28.1%, SKHY +14.5% and SNOW +13.0%.
Bottom 3 performers: WMT -5.5%, APP -21.2% and GEV -9.3%.
Broadcom (AVGO) reported strong quarterly results, with AI revenue (49% of total sales) +221%. Management guided AI revenue to double to USD 115bn in 2027 and double again to USD 230bn in 2028. Management also addressed key investor concerns including competition and circular financing during the earnings call. The primary investor concern has been potential market share loss to MediaTek, AMD, and Marvell for Google TPUs. Broadcom expects its revenue from Google to continue to grow every year, and Anthropic is now expected to become Broadcom's largest AI customer in 2027, thus reducing its reliance on Google. Management's projection of 2028 EPS > USD 30 implies only ~12x forward PE, which we view as highly attractive given Broadcom's sustainable growth profile.
Nvidia (NVDA) reported another blowout quarter, with revenue +106% yoy to USD 96.2bn and guidance of USD 108bn this quarter – both exceeding already elevated buy-side expectations. Management also guided for 70% revenue growth next year based on supply already secured, well above the 45% consensus forecast. Given the 2027 supply is largely inelastic and already booked, the market is likely to favor companies that can successfully convert backlog into revenue through secured supply. We believe Nvidia deserves a rerating given it has secured a lion share of supply capacity.
SK Hynix (SKHY) experienced a major pullback in July. Fundamentally, DRAM spot prices continue to fluctuate at high levels as hyperscalers are optimizing their systems to mitigate rising memory costs. In Aug, SK Hynix announced a historic 40 trillion won share repurchase and expanded its target to return over 50% to shareholders. We expect memory prices to stay "higher for longer", given its critical role in AI infrastructure, long-term contracts and the HBM innovation which makes SK Hynix less cyclical. We believe SK Hynix deserves a valuation higher than the current 4x PE.
Snowflake (SNOW) reported 2Q revenue and guidance both beat elevated buyside expectations. Revenue +37% as clients continuously migrate data to Snowflake for AI application. In addition, Snowflake’s new AI product Cortex Code, an AI coding agent designed for database, continues to be adopted rapidly this quarter, and the adoption is bringing new workload to the core platform. We believe SNOW is one of the best software names to benefit from AI, but we are cautious about elevated expectations.
Meta (META) released Muse Spark 1.3, a powerful AI model which ranks No.1 in certain benchmarks. We see multiple catalysts ahead, including the launch of ‘Hatch’ AI Agent platform, a more powerful AI model Watermelon, and the Meta Connect 2026 event (September 23-24). We suggest investors continue to accumulate on weakness.
Lumentum (LITE) reported strong results, with revenue +24% qoq in 2Q and higher 3Q guidance. Shares rebounded sharply in August, as investors increasingly recognized optics as the clearest path to scaling next generation AI systems. As a high-power laser leader, LITE is well positioned across NPO, OCS, Coherent Lite, and other related architectures, and stands to benefit regardless of the winning architecture. The adoption of NVIDIA's NVL576 architecture and Google's OCS deployment also mark the beginning of a major scale-up optical networking cycle, which bodes well for Lumentum.
Eli Lilly (LLY) delivered a stellar 2Q2026 beat-and-raise. Top-line growth was driven by a robust 60% volume increase, partially offset by a 13% decline in realized prices, reflecting the broader industry issue of Most-Favoured-Nation (MFN) pricing dynamics. Key products revenue growth was led by the blockbuster GLP-1 franchises Mounjaro and Zepbound. Non-GAAP EPS grew 33% yoy to USD 8.38, supported by an expanding gross margin of 85.8% (vs. 84.3% previously). Management raised FY2026 revenue guidance to USD 85–87bn (from USD 82–85bn), driven by volume growth rather than price hikes. Operationally, LLY continues to invest aggressively for the long term, with R&D rising 14% to USD 3.8bn and an additional USD 4.5bn committed to its Indiana plant expansion. We hereby reiterate our Core Recommendation on Eli Lilly as the undisputed global leader in innovative medicines. The stock currently trades at ~26x forward P/E, which is attractive compared to consensus expectations of ~20% EPS growth in FY2026 and ~17% growth in FY2027.
Walmart (WMT) reported a beat for 2QFY2027, yet the stock had a sharp 8.9% single-day decline. Revenue grew robustly, with global eCommerce rising 23% and Walmart US comp sales up 2.6%. Adjusted EPS came in at USD 0.81, or up 19.1% yoy. Management also raised its FY2027 adjusted EPS guidance. So what drove the post-earnings share weakness?
Weakening US consumption: US comp sales decelerated to 2.6% growth (below the 3.5% consensus), driven by weaker transaction growth and an 80 bps headwind from health & wellness. This has sparked a key debate over how much worse the US consumption can get, especially as broader retail data deteriorated in July.
Near-term guidance miss: Despite raising full-year adjusted EPS guidance to USD 2.80–2.87, the 3Q EPS guidance of USD 0.62–0.64 missed the consensus estimate of USD 0.68, mainly due to weaker drug pricing dynamics.
Competition fears: Notably, management omitted commentary regarding the pace of market share gains by peers, which raised fears that competitive pressures are intensifying in core grocery and general merchandise segments.
We maintain our Core Recommendation on WMT given its unmatched scale, advertising momentum, and defensive market share gains. The stock currently trades at a forward P/E of ~37x.
Berkshire Hathaway (BRK/B) reported a solid 2Q2026 operating earnings beat, with operating earnings +16% yoy to USD 12.98bn from USD 11.16bn a year earlier. Manufacturing, service, and retailing was a standout driver, jumping 24% to USD 4.47bn. The key notable on Berkshire was capital allocation: Berkshire repurchased USD 4.5bn of its own shares in 2Q2026, a sharp acceleration from the USD 235mn buyback in 1Q2026. Furthermore, the company turned into a net buyer of equities with nearly USD 20bn of net purchases, marking the first real evidence of deploying its massive cash pile (following 14 consecutive quarters of net selling). Its cash remained substantial at of USD 365.5bn, though down from the USD 397.4bn three months earlier. Recent 13F filings (14 Aug) revealed 15 portfolio changes, most notably a USD 17bn addition to its Alphabet (GOOGL) stake – now the fourth-largest position at 9.41% of its portfolio. Market reaction was somewhat muted as the buyback was a bit less than the high expectations. We maintain our positive view on BRK/B as a core defensive holding. The stock currently trades at a forward P/E of ~22.7x.
Occidental (OXY) delivered a clean 2Q2026 beat, with adjusted EPS from continuing operations of USD 2.40, comfortably beating market estimate of USD 1.92 by 25%. OXY revenues surged 57.1% yoy to USD 8.33bn, 16% higher than consensus. Net income attributable to common stockholders reached USD 2.8bn, and free cash flow before working capital from continuing operations hit USD 3.0bn — the highest since 3Q22 — on capex of USD 1.6bn. Global production of 1,433 Mboed exceeded the high end of management's guidance, while midstream and marketing pre-tax adjusted income also beat estimates, surging to USD 961mn from USD 196mn a year earlier. OXY’s bottom-up strength also provides a positive read-across for the broader energy sector (XLE is also our Core Recommendation). Operationally, the transition remains smooth following the CEO succession announced in May. We maintain our Core Recommendation on OXY given its robust cash generation, production upside, and disciplined capital allocation. The stock currently trades at ~15x forward P/E, with analysts projecting a ~26% EPS CAGR through 2028.
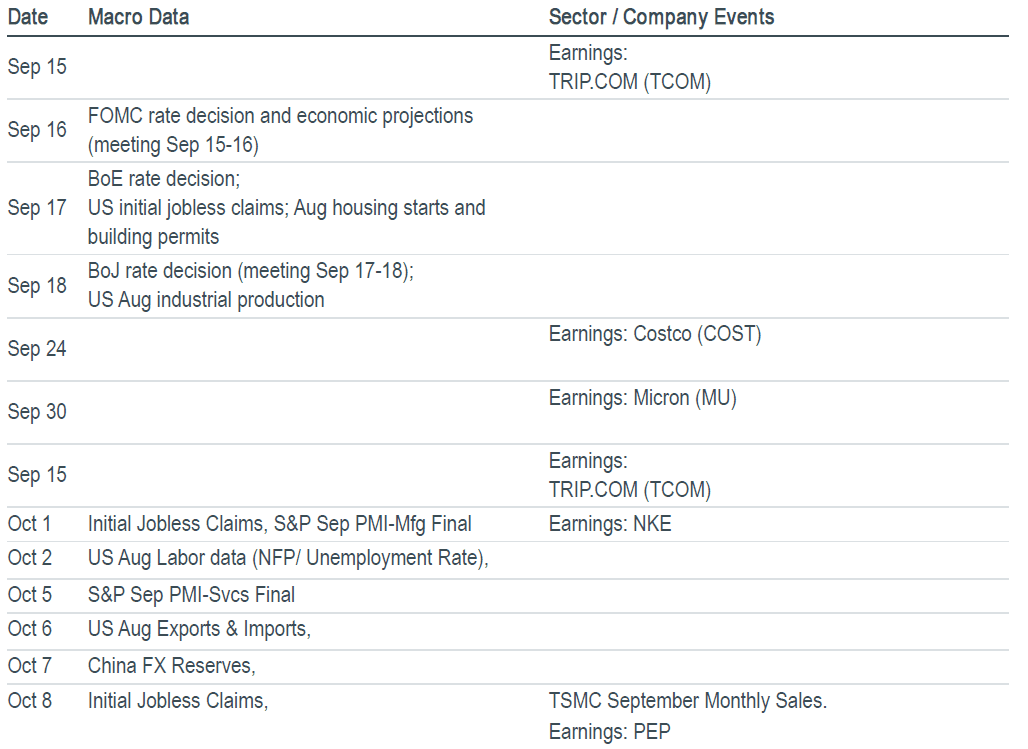
Must watch events in September: US Aug ISM manufacturing index (Sep 1), Fed Beige Book (Sep 2), US Aug Labour Data/NFP (Sep 4), US Aug PPI (Sep 10), US Aug CPI (Sep 11), US Retail Sales (Sep 16), the pivotal September FOMC and rate decision (Sep 15-16), and Chinese President’s visit to the US (Sep 24). Earnings: DELL (Sep 1), AVGO and SNOW (Sep 2), ORCL (Sep 9), and ADBE (Sep 10). For more information, please see Appendix B.
China Equities
The Hang Seng Index (H-shares) fell 1.2% in August, while the CSI 300 (A-shares) gained 0.8% last month, again showing that the onshore A-share market was less vulnerable to global volatility. Fundamentals-wise, weak domestic demand continues to cap a broad earnings recovery (“Growing Pains”), while AI monetisation, improving operating discipline, China’s Export Shock 2.0 are supporting company-specific opportunities. Stock-wise, we added to Tencent and Alibaba on weakness and re-entered Meituan as a Trading Buy.
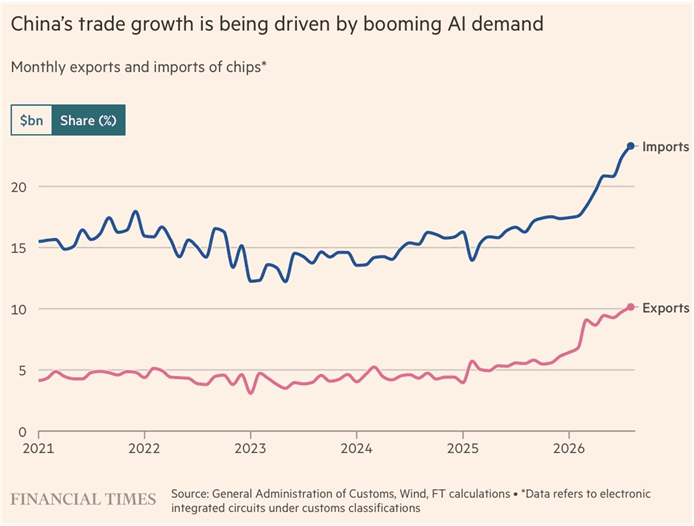
China’s Growing Pains persist, with exports also losing momentum. August exports grew 25.0% yoy, up from 23.9% in July but still below the 25.9% consensus. Imports rose 28.2%, up from 27.6% in July but below the 31.0% estimate. Trade surplus widened to USD 119.1bn, in line with expectations. Export momentum is slowing across the EU, ASEAN and Japan, while imports are rising on the back of an 83.6% surge in integrated circuit inflows, resulting in a negative impact on the overall economy. This adds to economic pressures already stemming from a struggling real estate market and slowing consumption.
Policy support continues to focus on capital markets and financial conditions. Following the recent National Team buying of publicly trade stocks, China is planning to inject up to RMB 260bn (USD 38.8bn) into state-owned banks ICBC and ABC via targeted A-share placements. The move is expected to strengthen bank balance sheets, provide liquidity support, improve credit transmission, buttress investor sentiment and stock valuations. There is not yet a direct impact on the economy, yet stabilising financial conditions could eventually reduce the risk of a deeper slowdown.
Stick with our Barbell Strategy. Against the backdrop of China’s Growing Pains and the lack of outsized stimulus, we continue to recommend our Barbell Strategy combining structural growth companies (including AI) with defensive, high dividend yield stocks (mostly SOEs). In fact, this is our all-weather approach regardless of the macro environment.
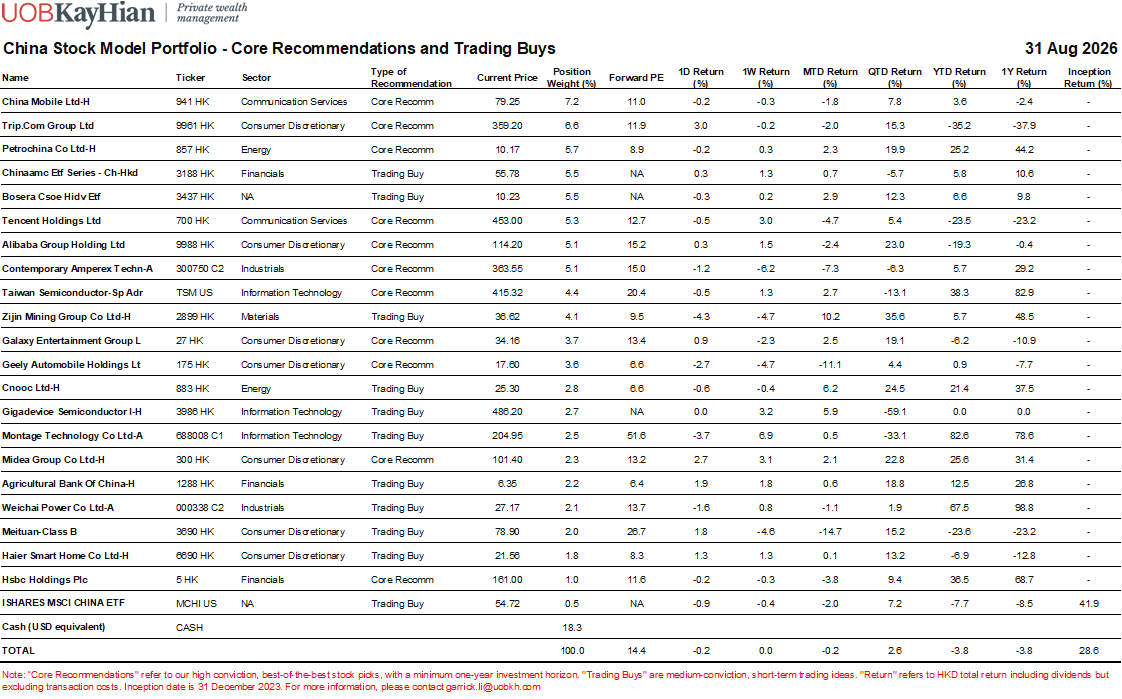
Source: UOB Kay Hian and Bloomberg. As of August 31, 2026
Fixed Income
Below is the CIO Summary from our latest Fixed Income Monthly (Sep 7, 2026), for Professional / Accredited Investors only. Ping benjamintan@uobkh.com if you’d like to receive the full report.
Labor market strength keeps December hike in play. The latest labor market data remain surprisingly resilient, supporting the Fed’s hawkish stance. We continue to believe that a December rate hike is more likely than a September one.
Fed vs. Treasury: two drunken sailors on different routes. Treasury Secretary Bessent and Fed Chair Warsh seem to be pursuing divergent policies right now, creating higher uncertainty at the long-end and reinforcing our preference for the short-end.
Yet tied by a tether. Bessent and Warsh know that their playbooks can directly interfere with each other, and they must calibrate their moves carefully to manage any cross-currents. That "tether" ensures that neither can go too far without undermining their shared goals. Buying opportunities arise when investors completely write off this tether — but we are not there yet.
AI-related bond or equity – but not both. Alphabet's inaugural AUD Kangaroo bond highlights the US hyperscaler's ability to diversify funding across non-USD markets. This could become an emerging trend and further expanding AI concentration risk.
Amid the uncertain macro environment and rising AI concentration risk, we maintain our Core Recommendation on short-duration, high-quality, investment-grade bonds.
Commodities
Gold maintains positive momentum despite fluctuating real yields. Following a breakout in early August, gold continued to advance, now trading in the USD 4,387–4,522/oz range in early September. The technical bias remains positive, with potential near-term upside targets revised higher to USD 4,600/oz and USD 4,800/oz, in line with the latest institutional forecasts. On the downside, USD 4,350/oz is the first near-term support and USD 4,200/oz remains a crucial level.
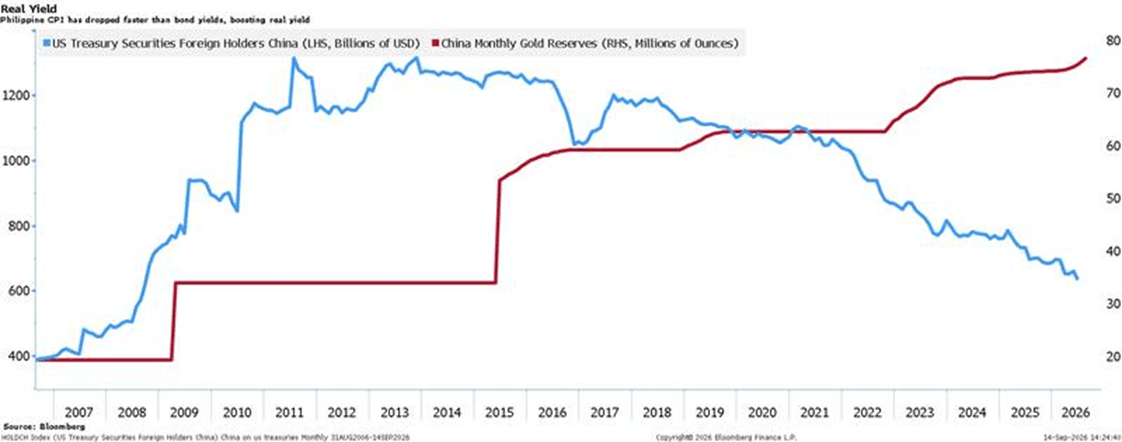
Central-bank demand continues to provide fundamental, longer-term support for gold. Official sector purchases rebounded strongly to 289 tonnes in 2Q2026 from a revised 57 tonnes in 1Q2026, taking 1H2026 buying to about 346 tonnes. The World Gold Council’s mid-year survey showed that 89% of central banks expect global gold reserves to increase over the next 12 months, and a record 45% of them plan to raise holdings. China’s steady accumulation of gold alongside a longer-term decline in its US Treasury holdings also reinforces gold as a top beneficiary of de-dollarisation trends.
Investors seeking exposure to gold can consider Gold ETF (2840.HK) or SPDR Gold Shares (GLD) for physical bullion exposure – both of which remain our Core Recommendations.
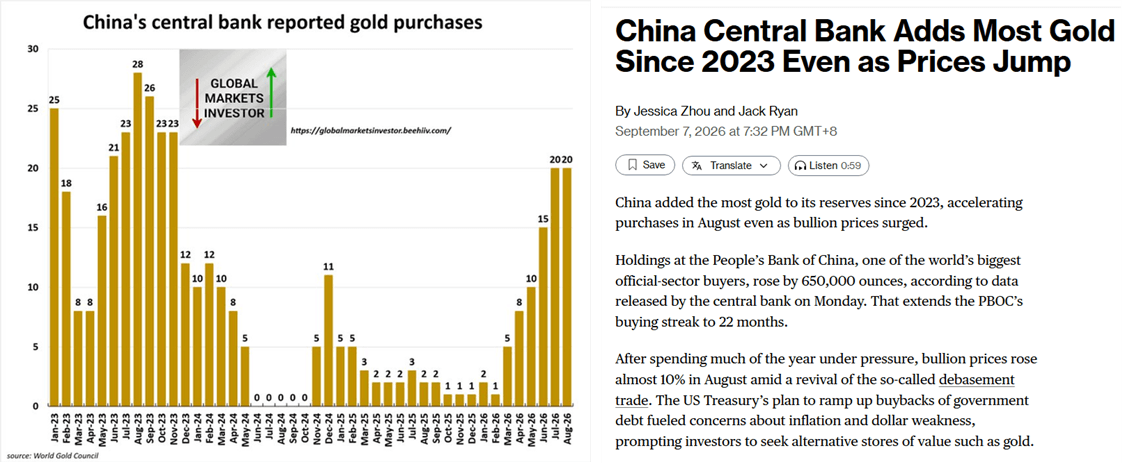
Source: World Gold Council and Bloomberg
Global Central Banks, especially China, continue to buy gold and sell Treasuries
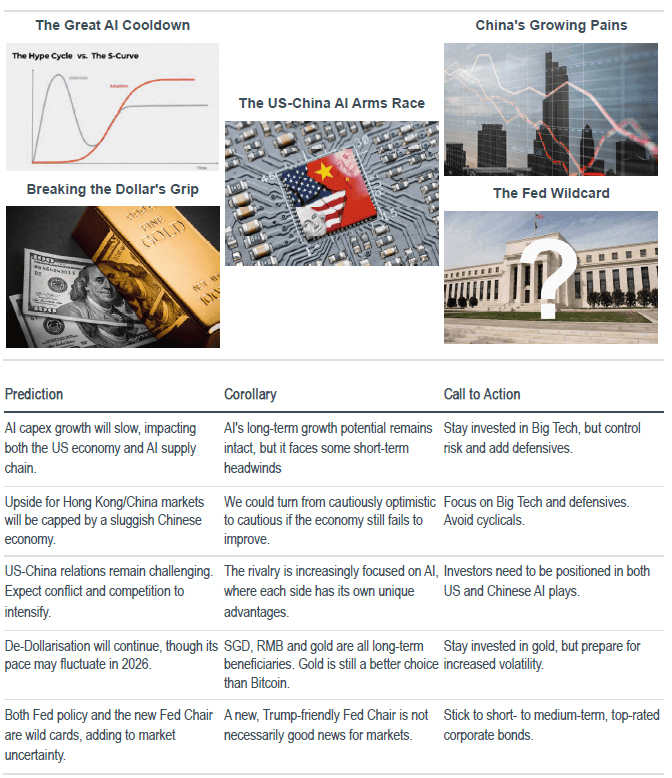
Appendix A: Our Top Five Predictions for 2026
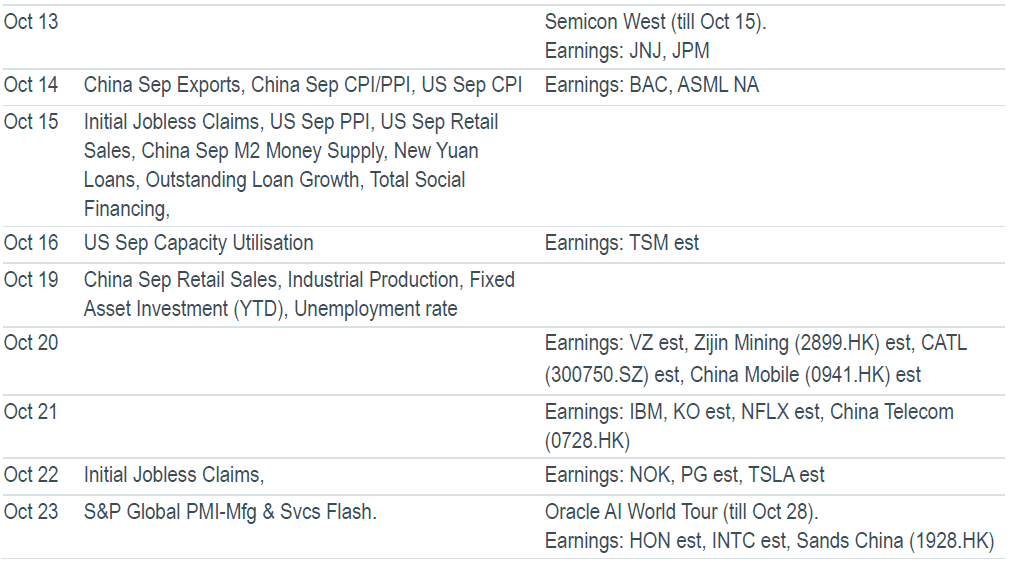
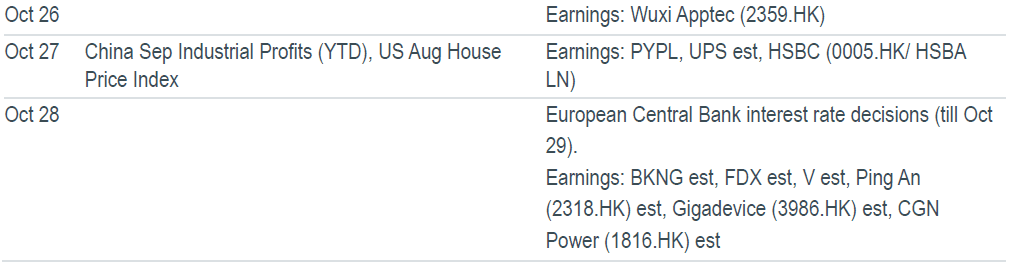
Appendix B: Must Watch Events for Sep & Oct 2026
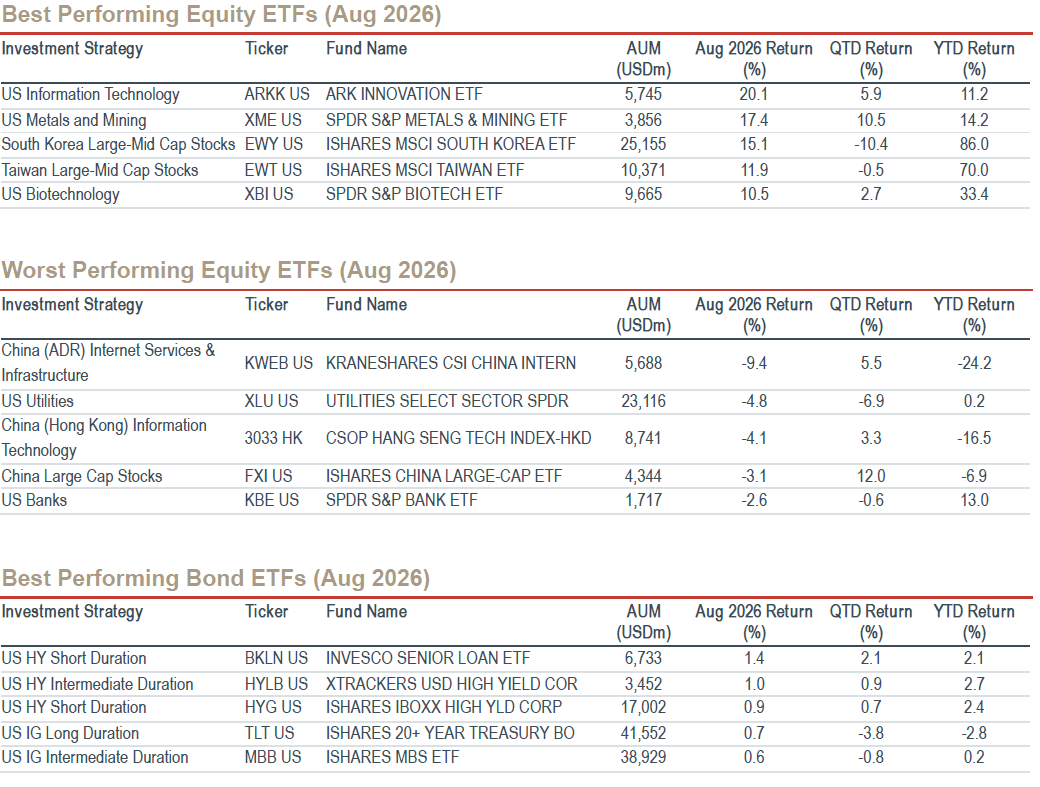
Appendix C: Global ETF Toolkit Highlights
Appendix D: Roadmap to Private Wealth Management Research
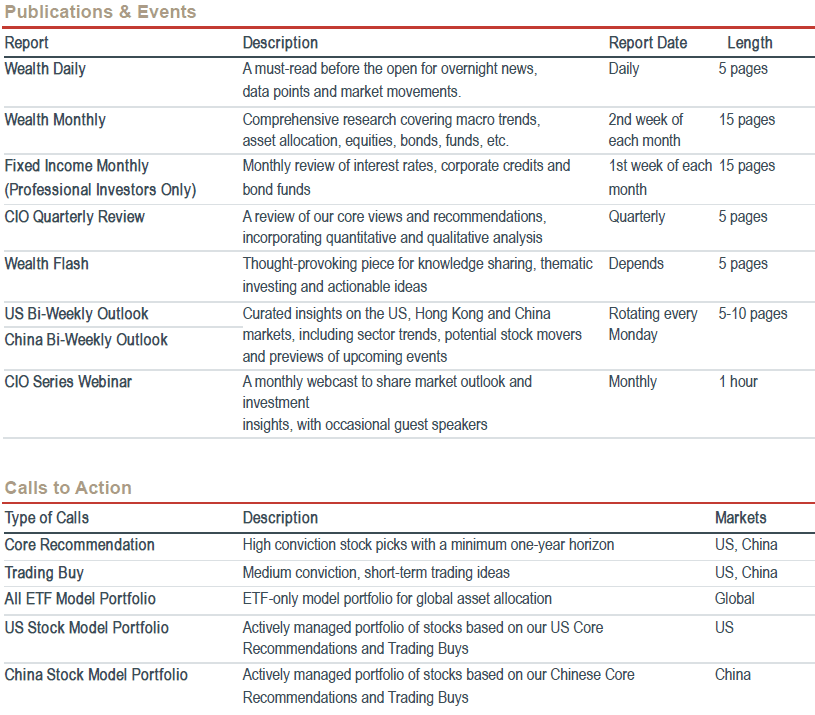
Note: Report lengths are approximate and may vary. Please contact research@uobkh.com if you’d like to subscribe to any research above.
Be sure to subscribe to our Wealth Vision YouTube channel, including replays of our CIO Series and much more.
https://www.youtube.com/@uobkh_wealthvision
CIO Summary
Three layers of the Fed Wildcard. In this report, and for the first time, we clarified the three layers of the Fed Wildcard – each representing a specific source of uncertainty and a different time frame. We are short-term bearish, medium-term cautious and long-term bullish.
Our All ETF Model Portfolio for global asset allocation gained 2.0% in August and returned 6.7% YTD. The Energy Select ETF (XLE) and Emerging Markets ex-China (EMXC) were the largest contributors, while Industrials (XLI) and the Hang Seng Index ETF (2800.HK) were the biggest detractors.
Our US Stock Model Portfolio gained 1.8% in August and returned 8.7% YTD. Top 3 performers: LITE +28.1%, SKHY +14.5% and SNOW +13.0%.
Our China Stock Model Portfolio dropped 0.2% in August and lost 3.8% YTD. Top 3 performers: 2899.HK +10.2%, 883.HK +6.2% and 3986.HK +5.9%.
Fixed income: maintain our Core Recommendation on high-quality, investment-grade bonds with short durations (< 3 years).
Commodities: Continued central bank buying provides long-term support, reinforcing gold (2840.HK or GLD) as a top beneficiary of de-dollarisation.
Core Views and Recommendations
CIO Commentary
We've been absolutely right about "the Fed Wildcard" – one of our top predictions for 2026. The “Two Drunken Sailors” analogy refers to an additional layer of uncertainty beyond the traditional hawkish versus dovish debate. Below are the three layers of the “Fed Wildcard” that we see right now.
Layer 1: the Surface Story. The usual debate over whether the Fed is leaning hawkish (raising rates) or dovish (cutting rates) is important but could be superficial. Based solely on macro data and FOMC statements, markets can often fall into “false hawkishness" or “false dovishness”. Such misinterpretations can be traced back to mixed or conflicting data, and the lack of clear Fed guidance since new Chair Kevin Warsh took office. This narrative is somewhat superficial, not only because expectations for rate hikes can shift rapidly (doubling overnight), but also because additional factors (layers) can interfere with and even alter the Fed policy trajectory, triggering surprising market reactions. This helps explain why the stock markets could go up on hawkish data or signals in recent weeks, and vice versa.
Layer 2: the Deeper Problem. A new and deeper problem today is that the Fed and the Treasury seem to be pulling in different directions. For example, Treasury Secretary Scott Bessent is trying to push long-term yields down by doubling long bond buybacks and issuing more short-term bills. Meanwhile, the new Fed has signalled plans to reduce its USD 7 trillion balance sheet by moving away from long bonds and possibly raise (short-term) rates this year. More information on
Fed vs. Treasury: Two Drunken Sailors tied by a Tether can be found in the Fixed Income section below or our latest Fixed Income Monthly (Professional Investors only)
Layer 3: the Real Deal. Beyond the current conflict and confusion, the long-term outlook could be quite positive. This is because we may have the most technologically informed and innovation-friendly Fed Chair in history. Warsh has spoken publicly on several occasions about AI’s potential economic benefits: boosting productivity and helping contain inflation. If these productivity gains materialise, we believe AI could reduce the need for frequent Fed policy adjustments and further dampen market volatility. That is a big “if”, however, as AI has been more inflationary than deflationary so far.
Call to Action
Don’t just focus on rate hikes or rate cuts alone, even though they often drive short-term market volatility. Pay close attention to bigger issues that could influence the medium-to-long-term Fed policy. Given current constraints, the Fed can be neither too hawkish nor too dovish, creating trading opportunities when markets take on extreme views. We will keep you informed when such opportunities arise.
Stay invested in AI. AI is long-term positive for the economy and financial markets, and top-down macro risks do not justify giving up on AI investments. Some investors tend to sell all AI stocks when macro goes the wrong way and panic sets in, leading to significant market timing risk. We advise clients to stay invested in a diversified portfolio of AI + defensive stocks (our Barbell Strategy), while managing equity exposures accordingly based on fundamentals and valuation.
As a reference, we currently have around 34% invested in AI (with a focus on AI hardware), 24% in defensives, 10% in energy and others and 26% cash in our US Stock Model Portfolios. Our China Stock Model Portfolio is constructed along similar lines. More information can be found in the Equity section below.
Asset Allocation (All ETF Model Portfolio)
Source: UOB Kay Hian and Bloomberg. As of August 31, 2026.
Our All ETF Portfolio for global asset allocation was +2.0% in August and +6.7% YTD. The Energy Sector ETF (XLE) and Emerging Markets ex-China (EMXC) were the strong performers, +7.4% and +6.6% respectively. Meanwhile, Industrials (XLI) and the Hang Seng Index ETF (2800.HK) were the biggest detractors, -2.6% and -1.2% respectively.
US equity UNDERWEIGHT (28.9% vs. 36.1%). In August, we took profits in Energy (XLE) following another sharp spike in oil prices amid renewed US-Iran tensions. We also locked in some gains in the Semiconductor Sector ETF (SOXX) following its recent rebound.
Developed Markets ex-US UNDERWEIGHT (10.2% vs. 16.4%). DM ex-US (IDEV) gained 2.4% in August, driven mainly by Japan’s recovery as related to the semiconductor rebound. Similar to S&P 500, IDEV remained up low double digits YTD.
Emerging Markets ex-China UNDERWEIGHT (4.3% vs. 5.6%). EM ex-China (EMXC) rose 6.6% in August, fuelled by a sharp rebound in Korea (also AI and semis-related). EMXC remained up 36% YTD, making it one of the best performing regions globally.
China equity OVERWEIGHT (7.0% vs. 2.2%). The Hang Seng Index ETF (2800.HK) declined 1.2% in August after a strong rally in July, while China’s CSI 300 ETF gained only 0.8% – both related to China’s Growing Pains and the lack of major stimulus.
Fixed income EQUAL-WEIGHT (39.2% vs. 39.0%). Fixed income was gained just 0.2% in August as the Treasury market struggled to stabilise amid government intervention and the Fed Wildcard. The Intermediate-term Corporate Bond ETF (VCIT) rose 0.2% in August yet remained down 0.4% YTD, while the Short-term Corporate Bond ETF (VCSH) rose 0.3% last month and remained up 1.1% YTD. This continues to reinforce our Core Recommendation to stay short-duration in today’s uncertain rate environment.
Gold OVERWEIGHT (4.8% vs. 0.0%). We took profits in Gold (2840 HK) following a nearly 10% rally in August. We view gold as a key beneficiary and a long-term hedge against geopolitical risk, currency volatility and de-dollarisation. However, given its strong gains in recent years and the Fed Wildcard, we intend to trade part of our gold position opportunistically within a preset range.
Equities
US Equities
August was a month of relief and rotation, validating our "constructive short-term outlook" stated last month. Following severe deleveraging in July, the S&P 500 rallied 3.4% in August, while the Nasdaq rebounded 4.1%. The previous panic in semiconductors, especially memory stocks, began to gradually subside, as AI fundamentals remained intact and the technical tape improved.
However, September is historically a bumpy month for US equities, not to mention our thesis of a potential “Sep-Oct market awakening”.
Jackson Hole and macro data triggered a sharp increase in rate hike expectations. Chair Warsh’s hawkish speech, blowout labour data and hotter-than-expected CPI inflation led to a dramatic increase in FedWatch rate hike probabilities, from 30% a month ago to 85% today for a September hike. The front-end is now pricing in undue hawkishness while the long-end continues to reach new highs (10-year Treasury yield approaching 5%), reflecting market concerns over sticky inflation.
The Fed Wildcard is evolving into multiple layers of complexity and uncertainty, beyond the traditional hawkish vs dovish debate. Please see our CIO Commentary on page 4 for details.
AI fundamentals remain intact. Despite a long list of macro worries, industry data points have yet to point to any deterioration in AI fundamentals. GPU rental prices continue to surge 50%-60% over the past seven months, while Meta, Google and Amazon all raised their full-year capex guidance during the 2Q results season, among other supportive evidence.
Broad earnings fundamentals are intact. Beyond AI, the broader earnings backdrop remains remarkably robust: 86% of S&P 500 companies that reported 2Q earnings have beaten estimates, resulting in a staggering 47% yoy increase in EPS – up from 27% growth in 1Q. As a result, Wall Street has lifted full year earnings growth estimates for S&P 500 and Nasdaq to 29.3% and 46.1%, respectively.
Potential credit market headwinds. While AI and tech equity risks are mainly illusory, the credit market could face some AI-related headwinds, with hyperscaler CDS spreads skyrocketing and potential spillovers to other markets. Refer to our Fixed Income section below for more information.
Caution warranted into Sep-Oct. From now until the midterm elections in early November, we advise investors to remain cautious given the risk of a potential awakening, as markets begin to reprice a series of macro uncertainties, including but not limited to geopolitical risks, oil driven-inflation concerns, the Fed Wildcard and domestic political turmoil etc. No need to panic. Just stick to our Barbell Strategy of AI + defensives (see below).
Source: UOB Kay Hian and Bloomberg. As of August 31, 2026.
Our US Stock Model Portfolio gained 1.8% in August and returned 8.7% YTD, underperforming S&P 500 (SPY) – which rose 2.7% in August and was up 13.1% YTD. The August lag was driven by Industrials (GEV -9.3%, XLI -2.6%), Communication Services (APP -21.2%, GOOGL -4.7%), Consumer Discretionary (AMZN -4.3%) and Consumer Staples (WMT -5.5%). This was partly offset by gains in Energy (OXY +5.4%, XLE +7.4%), Technology (NVDA +10.0%, NOK +10.9%, LITE +28.1%, SNOW +13%, SKHY +14.5%, MSFT +9.4%) and Healthcare (JNJ +4.2%, XLV+4.9%).
Cash rose to 23.1% at August-end, as we sold stocks to prepare for the Sep-Oct market awakening. We took profits in GOOGL, AMZN, AVGO, SOXX, SKHY and OXY, as well as trimming LITE, XLE, AMZN and XLP.
Top 3 performers: LITE +28.1%, SKHY +14.5% and SNOW +13.0%.
Bottom 3 performers: WMT -5.5%, APP -21.2% and GEV -9.3%.
Broadcom (AVGO) reported strong quarterly results, with AI revenue (49% of total sales) +221%. Management guided AI revenue to double to USD 115bn in 2027 and double again to USD 230bn in 2028. Management also addressed key investor concerns including competition and circular financing during the earnings call. The primary investor concern has been potential market share loss to MediaTek, AMD, and Marvell for Google TPUs. Broadcom expects its revenue from Google to continue to grow every year, and Anthropic is now expected to become Broadcom's largest AI customer in 2027, thus reducing its reliance on Google. Management's projection of 2028 EPS > USD 30 implies only ~12x forward PE, which we view as highly attractive given Broadcom's sustainable growth profile.
Nvidia (NVDA) reported another blowout quarter, with revenue +106% yoy to USD 96.2bn and guidance of USD 108bn this quarter – both exceeding already elevated buy-side expectations. Management also guided for 70% revenue growth next year based on supply already secured, well above the 45% consensus forecast. Given the 2027 supply is largely inelastic and already booked, the market is likely to favor companies that can successfully convert backlog into revenue through secured supply. We believe Nvidia deserves a rerating given it has secured a lion share of supply capacity.
SK Hynix (SKHY) experienced a major pullback in July. Fundamentally, DRAM spot prices continue to fluctuate at high levels as hyperscalers are optimizing their systems to mitigate rising memory costs. In Aug, SK Hynix announced a historic 40 trillion won share repurchase and expanded its target to return over 50% to shareholders. We expect memory prices to stay "higher for longer", given its critical role in AI infrastructure, long-term contracts and the HBM innovation which makes SK Hynix less cyclical. We believe SK Hynix deserves a valuation higher than the current 4x PE.
Snowflake (SNOW) reported 2Q revenue and guidance both beat elevated buyside expectations. Revenue +37% as clients continuously migrate data to Snowflake for AI application. In addition, Snowflake’s new AI product Cortex Code, an AI coding agent designed for database, continues to be adopted rapidly this quarter, and the adoption is bringing new workload to the core platform. We believe SNOW is one of the best software names to benefit from AI, but we are cautious about elevated expectations.
Meta (META) released Muse Spark 1.3, a powerful AI model which ranks No.1 in certain benchmarks. We see multiple catalysts ahead, including the launch of ‘Hatch’ AI Agent platform, a more powerful AI model Watermelon, and the Meta Connect 2026 event (September 23-24). We suggest investors continue to accumulate on weakness.
Lumentum (LITE) reported strong results, with revenue +24% qoq in 2Q and higher 3Q guidance. Shares rebounded sharply in August, as investors increasingly recognized optics as the clearest path to scaling next generation AI systems. As a high-power laser leader, LITE is well positioned across NPO, OCS, Coherent Lite, and other related architectures, and stands to benefit regardless of the winning architecture. The adoption of NVIDIA's NVL576 architecture and Google's OCS deployment also mark the beginning of a major scale-up optical networking cycle, which bodes well for Lumentum.
Eli Lilly (LLY) delivered a stellar 2Q2026 beat-and-raise. Top-line growth was driven by a robust 60% volume increase, partially offset by a 13% decline in realized prices, reflecting the broader industry issue of Most-Favoured-Nation (MFN) pricing dynamics. Key products revenue growth was led by the blockbuster GLP-1 franchises Mounjaro and Zepbound. Non-GAAP EPS grew 33% yoy to USD 8.38, supported by an expanding gross margin of 85.8% (vs. 84.3% previously). Management raised FY2026 revenue guidance to USD 85–87bn (from USD 82–85bn), driven by volume growth rather than price hikes. Operationally, LLY continues to invest aggressively for the long term, with R&D rising 14% to USD 3.8bn and an additional USD 4.5bn committed to its Indiana plant expansion. We hereby reiterate our Core Recommendation on Eli Lilly as the undisputed global leader in innovative medicines. The stock currently trades at ~26x forward P/E, which is attractive compared to consensus expectations of ~20% EPS growth in FY2026 and ~17% growth in FY2027.
Walmart (WMT) reported a beat for 2QFY2027, yet the stock had a sharp 8.9% single-day decline. Revenue grew robustly, with global eCommerce rising 23% and Walmart US comp sales up 2.6%. Adjusted EPS came in at USD 0.81, or up 19.1% yoy. Management also raised its FY2027 adjusted EPS guidance. So what drove the post-earnings share weakness?
Weakening US consumption: US comp sales decelerated to 2.6% growth (below the 3.5% consensus), driven by weaker transaction growth and an 80 bps headwind from health & wellness. This has sparked a key debate over how much worse the US consumption can get, especially as broader retail data deteriorated in July.
Near-term guidance miss: Despite raising full-year adjusted EPS guidance to USD 2.80–2.87, the 3Q EPS guidance of USD 0.62–0.64 missed the consensus estimate of USD 0.68, mainly due to weaker drug pricing dynamics.
Competition fears: Notably, management omitted commentary regarding the pace of market share gains by peers, which raised fears that competitive pressures are intensifying in core grocery and general merchandise segments.
We maintain our Core Recommendation on WMT given its unmatched scale, advertising momentum, and defensive market share gains. The stock currently trades at a forward P/E of ~37x.
Berkshire Hathaway (BRK/B) reported a solid 2Q2026 operating earnings beat, with operating earnings +16% yoy to USD 12.98bn from USD 11.16bn a year earlier. Manufacturing, service, and retailing was a standout driver, jumping 24% to USD 4.47bn. The key notable on Berkshire was capital allocation: Berkshire repurchased USD 4.5bn of its own shares in 2Q2026, a sharp acceleration from the USD 235mn buyback in 1Q2026. Furthermore, the company turned into a net buyer of equities with nearly USD 20bn of net purchases, marking the first real evidence of deploying its massive cash pile (following 14 consecutive quarters of net selling). Its cash remained substantial at of USD 365.5bn, though down from the USD 397.4bn three months earlier. Recent 13F filings (14 Aug) revealed 15 portfolio changes, most notably a USD 17bn addition to its Alphabet (GOOGL) stake – now the fourth-largest position at 9.41% of its portfolio. Market reaction was somewhat muted as the buyback was a bit less than the high expectations. We maintain our positive view on BRK/B as a core defensive holding. The stock currently trades at a forward P/E of ~22.7x.
Occidental (OXY) delivered a clean 2Q2026 beat, with adjusted EPS from continuing operations of USD 2.40, comfortably beating market estimate of USD 1.92 by 25%. OXY revenues surged 57.1% yoy to USD 8.33bn, 16% higher than consensus. Net income attributable to common stockholders reached USD 2.8bn, and free cash flow before working capital from continuing operations hit USD 3.0bn — the highest since 3Q22 — on capex of USD 1.6bn. Global production of 1,433 Mboed exceeded the high end of management's guidance, while midstream and marketing pre-tax adjusted income also beat estimates, surging to USD 961mn from USD 196mn a year earlier. OXY’s bottom-up strength also provides a positive read-across for the broader energy sector (XLE is also our Core Recommendation). Operationally, the transition remains smooth following the CEO succession announced in May. We maintain our Core Recommendation on OXY given its robust cash generation, production upside, and disciplined capital allocation. The stock currently trades at ~15x forward P/E, with analysts projecting a ~26% EPS CAGR through 2028.
Must watch events in September: US Aug ISM manufacturing index (Sep 1), Fed Beige Book (Sep 2), US Aug Labour Data/NFP (Sep 4), US Aug PPI (Sep 10), US Aug CPI (Sep 11), US Retail Sales (Sep 16), the pivotal September FOMC and rate decision (Sep 15-16), and Chinese President’s visit to the US (Sep 24). Earnings: DELL (Sep 1), AVGO and SNOW (Sep 2), ORCL (Sep 9), and ADBE (Sep 10). For more information, please see Appendix B.
China Equities
The Hang Seng Index (H-shares) fell 1.2% in August, while the CSI 300 (A-shares) gained 0.8% last month, again showing that the onshore A-share market was less vulnerable to global volatility. Fundamentals-wise, weak domestic demand continues to cap a broad earnings recovery (“Growing Pains”), while AI monetisation, improving operating discipline, China’s Export Shock 2.0 are supporting company-specific opportunities. Stock-wise, we added to Tencent and Alibaba on weakness and re-entered Meituan as a Trading Buy.
China’s Growing Pains persist, with exports also losing momentum. August exports grew 25.0% yoy, up from 23.9% in July but still below the 25.9% consensus. Imports rose 28.2%, up from 27.6% in July but below the 31.0% estimate. Trade surplus widened to USD 119.1bn, in line with expectations. Export momentum is slowing across the EU, ASEAN and Japan, while imports are rising on the back of an 83.6% surge in integrated circuit inflows, resulting in a negative impact on the overall economy. This adds to economic pressures already stemming from a struggling real estate market and slowing consumption.
Policy support continues to focus on capital markets and financial conditions. Following the recent National Team buying of publicly trade stocks, China is planning to inject up to RMB 260bn (USD 38.8bn) into state-owned banks ICBC and ABC via targeted A-share placements. The move is expected to strengthen bank balance sheets, provide liquidity support, improve credit transmission, buttress investor sentiment and stock valuations. There is not yet a direct impact on the economy, yet stabilising financial conditions could eventually reduce the risk of a deeper slowdown.
Stick with our Barbell Strategy. Against the backdrop of China’s Growing Pains and the lack of outsized stimulus, we continue to recommend our Barbell Strategy combining structural growth companies (including AI) with defensive, high dividend yield stocks (mostly SOEs). In fact, this is our all-weather approach regardless of the macro environment.
Source: UOB Kay Hian and Bloomberg. As of August 31, 2026
Fixed Income
Below is the CIO Summary from our latest Fixed Income Monthly (Sep 7, 2026), for Professional / Accredited Investors only. Ping benjamintan@uobkh.com if you’d like to receive the full report.
Labor market strength keeps December hike in play. The latest labor market data remain surprisingly resilient, supporting the Fed’s hawkish stance. We continue to believe that a December rate hike is more likely than a September one.
Fed vs. Treasury: two drunken sailors on different routes. Treasury Secretary Bessent and Fed Chair Warsh seem to be pursuing divergent policies right now, creating higher uncertainty at the long-end and reinforcing our preference for the short-end.
Yet tied by a tether. Bessent and Warsh know that their playbooks can directly interfere with each other, and they must calibrate their moves carefully to manage any cross-currents. That "tether" ensures that neither can go too far without undermining their shared goals. Buying opportunities arise when investors completely write off this tether — but we are not there yet.
AI-related bond or equity – but not both. Alphabet's inaugural AUD Kangaroo bond highlights the US hyperscaler's ability to diversify funding across non-USD markets. This could become an emerging trend and further expanding AI concentration risk.
Amid the uncertain macro environment and rising AI concentration risk, we maintain our Core Recommendation on short-duration, high-quality, investment-grade bonds.
Commodities
Gold maintains positive momentum despite fluctuating real yields. Following a breakout in early August, gold continued to advance, now trading in the USD 4,387–4,522/oz range in early September. The technical bias remains positive, with potential near-term upside targets revised higher to USD 4,600/oz and USD 4,800/oz, in line with the latest institutional forecasts. On the downside, USD 4,350/oz is the first near-term support and USD 4,200/oz remains a crucial level.
Central-bank demand continues to provide fundamental, longer-term support for gold. Official sector purchases rebounded strongly to 289 tonnes in 2Q2026 from a revised 57 tonnes in 1Q2026, taking 1H2026 buying to about 346 tonnes. The World Gold Council’s mid-year survey showed that 89% of central banks expect global gold reserves to increase over the next 12 months, and a record 45% of them plan to raise holdings. China’s steady accumulation of gold alongside a longer-term decline in its US Treasury holdings also reinforces gold as a top beneficiary of de-dollarisation trends.
Investors seeking exposure to gold can consider Gold ETF (2840.HK) or SPDR Gold Shares (GLD) for physical bullion exposure – both of which remain our Core Recommendations.
Source: World Gold Council and Bloomberg
Global Central Banks, especially China, continue to buy gold and sell Treasuries
Appendix A: Our Top Five Predictions for 2026
Appendix B: Must Watch Events for Sep & Oct 2026
Appendix C: Global ETF Toolkit Highlights
Appendix D: Roadmap to Private Wealth Management Research
Note: Report lengths are approximate and may vary. Please contact research@uobkh.com if you’d like to subscribe to any research above.
Be sure to subscribe to our Wealth Vision YouTube channel, including replays of our CIO Series and much more.
https://www.youtube.com/@uobkh_wealthvision
Disclosures and disclaimers
This report is provided subject to, and must be read together with, the full Disclosures / Disclaimers available at this link, which are incorporated by reference into this report. In particular, this report is intended for general circulation and informational purposes only and does not constitute personal investment advice or a recommendation to buy or sell any investment product or security. You should independently evaluate the information and, where necessary, seek advice from a qualified financial adviser regarding the suitability of any investment. Analyst certifications required under applicable regulations, including SEC Regulation AC (where relevant), are included in this report. By accessing, receiving or using this report, you acknowledge that you have read, understood and agreed to be bound by the Disclosures / Disclaimers, as may be amended, supplemented or updated from time to time.


