

Analyst
Qi Wang, CFA
qi.wang@uobkh.comAnalyst
Wendy Chen
wendy.chen@uobkh.comAnalyst
Benjamin Tan
benjamintan@uobkh.comFOR PROFESSIONAL INVESTORS OR ACCREDITED INVESTORS OR RELEVANT PERSON (CKA) ONLY
CIO Summary
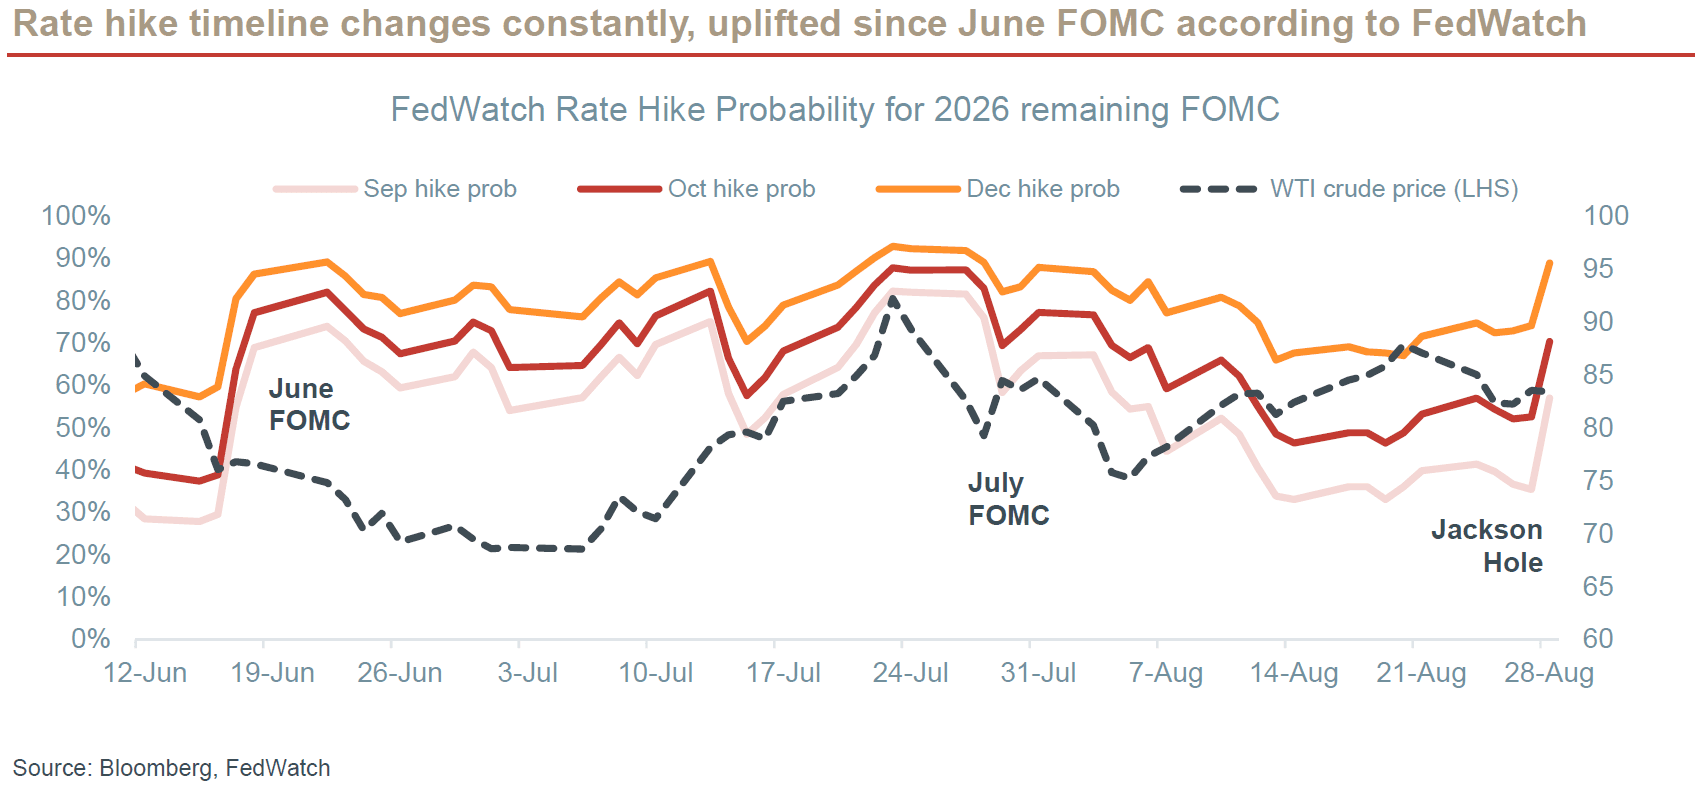
- Labor market strength keeps December hike in play. The latest labor market data remain surprisingly resilient, supporting the Fed’s hawkish stance. We continue to believe that a December rate hike is more likely than a September one.
- Fed vs. Treasury: two drunken sailors on different routes. Treasury Secretary Bessent and Fed Chair Warsh seem to be pursuing divergent policies right now, creating higher uncertainty at the long-end and reinforcing our preference for the short-end.
- Yet tied by a tether. Bessent and Warsh know that their playbooks can directly interfere with each other, and they must calibrate their moves carefully to manage any cross-currents. That "tether" ensures that neither can go too far without undermining their shared goals. Buying opportunities arise when investors completely write off this tether — but we are not there yet.
- AI-related bond or equity – but not both. Alphabet's inaugural AUD Kangaroo bond highlights the US hyperscaler's ability to diversify funding across non-USD markets. This could become an emerging trend and further expanding AI concentration risk.
- Amid the uncertain macro environment and rising AI concentration risk, we maintain our Core Recommendation on short-duration, high-quality, investment-grade bonds.
- Bond highlight: BABA 4.875% 26 May 2030
Bond Radar
Below is a list of popular investment-grade (IG) bonds curated by our Products Team. These are for reference only and do not constitute our recommendations. For further details, please contact our fixed-income & credit specialist, Benjamin Tan Shun Chao at benjamintan@uobkh.com.
Asia Non-Financial Corporates
Company | Bond Name | ISIN | Current Price (Sep 3) | YTM (%) | Duration (y) | 6M Performance (%) |
Abu Dhabi | TAQAUH 4.375% | XS2600246552 | USD 98.73 | 4.94 | 2.22 | -1.61 |
Abu Dhabi’s government-owned energy and water conglomerate with the world’s largest single-site solar power plant and other renewables. | ||||||
Singtel | STSP 2.375% | XS2046591413 | USD 93.68 | 4.68 | 2.82 | -1.21 |
State-owned telecom. Largest in Singapore, second in Australia (Optus) and India (Bharti Airtel). Invests in 5G, cloud, and cybersecurity. | ||||||
Petronas | PETMK 3.50% 21 Apr 2030 | USY68856AT38 | USD 95.25 | 4.95 | 3.31 | -2.33 |
Malaysia’s fully government-owned national oil company, operating across the entire oil and gas value chain with strong state support, robust cash generation, and a globally diversified asset base. | ||||||
TSMC | TAISEM 4.125% | US872898AG66 | USD 98.69 | 4.66 | 2.43 | -1.59 |
Top semiconductor manufacturer with leading technologies like the first commercial extreme-ultraviolet lithography (EUV). | ||||||
Alibaba | BABA 4.875% | USG01719AK24 | USD 100.01 | 4.87 | 3.33 | -2.94 |
China’s largest e-commerce company with around 50% market share and a growing user base. Leading cloud provider in Asia Pacific. | ||||||
CNPC Global | CNPCCH 2% | XS2179918037 | USD 90.8 | 4.67 | 3.56 | -1.95 |
| China's largest government-owned oil and gas producer and supplier. One of the world's major oilfield service providers and a globally recognized contractor in engineering construction. | |||||
CNOOC FINANCE | CNOOC 2.875% | US12625GAF19 | USD 94.72 | 4.74 | 2.85 | -1.69 |
| China's state-owned and largest producer of offshore crude oil and natural gas. Known for its pioneering deepwater drilling capabilities. | |||||
Meituan
| MEITUA 4.625% 2 Oct 2029 | USG59669AF11 | USD 98.3 | 5.23 | 2.77 | -2.31 |
| Leading Chinese e-commerce platform for local services, offering a wide range of services such as food delivery, travel booking, and entertainment through its app. | |||||
JD.com
| JD 3.375% 14 Jan 2030 | US47215PAE60 | USD 95.75 | 4.76 | 3.11 | -1.93 |
One of China’s largest e-commerce platforms, focusing on high-quality, branded products, and in-house logistics, making it the leader in categories like electronics and home appliances. | ||||||
Xiaomi
| XIAOMI 3.375% 29 Apr 2030 | USY77108AA93 | USD 94.58 | 5.02 | 3.34 | -1.96 |
| Leading Chinese technology company that designs smartphones, smart devices, and IoT products, recently expanding into electric vehicles | |||||
SK Hynix
| HYUELE 4.375% 9 Nov 2030 | USY8085FBZ28 | USD 97.32 | 5.12 | 3.55 | -3.29 |
| SK Hynix is the world’s second-largest memory chipmaker and a key beneficiary of the global AI-driven demand for high-bandwidth memory. | |||||
Singapore Airlines
| SIASP 3.5% | SGXF10397887 | SGD 104.39 | 2.40 | 3.90 | -1.17 |
| Temasek-controlled, Singapore’s flag carrier with a young fleet and robust liquidity, benefitting from quasi-sovereign support. Operating a full-service carrier (SIA) and low-cost carrier (Scoot) across 130-plus destinations. | |||||
MPACT Treasury
| MCTSP 4.25% 29 Mar 2030 | SGXF59943971 | SGD 106.31 | 2.39 | 3.25 | -1.58 |
| Temasek-backed REIT, owning flagship VivoCity and diversified Grade-A assets across Singapore, Hong Kong and North Asia, providing resilient distributions with organic growth upside. | |||||
Starhub
| STHSP 2.48% 08 Jan 2031 | SGXF30667780 | SGD 99.96 | 2.49 | 4.07 | -0.76 |
| Integrated Singapore telco spanning mobile, broadband, pay-TV and enterprise-ICT services, leveraging 5G and digital platforms to stabilise cash flows and reignite growth. Majority-owned by ST Telemedia, a wholly owned Temasek portfolio company. | |||||
Source: Bloomberg. All prices and yields are indicative and for reference only. Please contact the UOB Kay Hian product team for more information.
US & Europe Non-Financials Corporates
Company | Bond Name | ISIN | Current Price (Sep 3) | YTM (%) | Duration (y) | 6M Performance (%) |
Microsoft | MSFT 1.35% | USU59340AK20 | USD 88.17 | 4.60 | 3.81 | -2.28 |
Big Tech leader with businesses in operating system, search engine, cloud computing, and artificial intelligence etc. A combination of stable cash flows and new growth opportunities. | ||||||
Meta | META 4.8% | US30303M8M79 | USD 99.61 | 4.92 | 3.30 | -3.37 |
Previously Facebook, the origin of today's social media trend. With a growing user base of nearly 4 billion (half of the world population). | ||||||
Nvidia
| NVDA 2.85% 01 Apr 2030 | US67066GAF19 | USD 93.39 | 4.89 | 3.29 | -2.72 |
A prominent chipmaker that designs graphics processing units (GPUs) for gaming and artificial intelligence. It held a dominant position in the graphics cards industry with an 80.2% market share in 2Q23. | ||||||
Costco | COST 1.6% | US22160KAP03 | USD 89.7 | 4.72 | 3.43 | -1.78 |
World's 3rd largest retailer which operates a chain of membership-only big-box warehouse club retail stores. | ||||||
Procter & Gamble | PG 4.35% | US742718GF07 | USD 99.79 | 4.44 | 2.25 | -2.30 |
Founded more than 180 years ago with operations in over 70 countries. Specialize in a wide range of personal health/consumer health, personal care, and hygiene products. | ||||||
Nestle | NESNVX 4.65% | USU6408XAK55 | USD 99.95 | 4.67 | 2.30 | -2.33 |
World's largest food and beverage company with over 2,000 brands and a presence in 188 countries. | ||||||
PepsiCo | PEP 4.1% | US713448GL64 | USD 98.96 | 4.57 | 2.21 | -1.87 |
Second-largest food and beverage business in the world based on net revenue, profit, and market capitalization. | ||||||
Coca-Cola Co | KO 2.125% | US191216CM09 | USD 93.1 | 4.61 | 2.83 | -1.66 |
Distributes the world's best-selling soft drink in over 200 countries, outselling its nearest competitor Pepsi by a significant margin. | ||||||
Pfizer | PFE 3.45% | US717081ET61 | USD 97.22 | 4.63 | 2.35 | -1.85 |
Founded in the mid-19th century, American drug maker with a strong and diversified drug portfolio. Biggest pharmaceutical company in the world based on the 2022 revenue. | ||||||
BP Capital America | BPLN 3.723% | US05565QDH83 | USD 97.98 | 4.69 | 2.09 | -1.63 |
Key player in the oil and gas industry that operates in 70 countries. It produces 2.3 million barrels of oil equivalent per day in 2022. | ||||||
McDonald's Corp | MCD 4.8% | US58013MFU36 | USD 100.24 | 4.66 | 1.76 | -1.80 |
The biggest fast-food chain in the world operating in the US and internationally with over 40,000 restaurants worldwide. | ||||||
Walt Disney | DIS 7.625% | USU25497AU95 | USD 106.68 | 4.45 | 2.02 | -2.68 |
Founded in 1923, a leading entertainment and production company known for its iconic animated film theme parks, streaming services, and media networks, creating magical experiences for audiences worldwide. | ||||||
JOHNSON & JOHNSON | JNJ 4.9% | US478160CV47 | USD 100.88 | 4.68 | 4.01 | -3.41 |
Johnson & Johnson manufactures health care products and provides related services for the consumer, pharmaceutical, and medical devices and diagnostics markets. The Company sells products such as skin and hair care products, acetaminophen products, pharmaceuticals, diagnostic equipment, and surgical equipment in countries located around the world. | ||||||
Source: Bloomberg. All prices and yields are indicative and for reference only. Please contact the UOB Kay Hian product team for more information.
Global Financial Institutions
Company | Bond Name | ISIN | Current Price (Sep 3) | YTM (%) | Duration (y) | 6M Performance (%) |
JP Morgan | JPM 4.005% | US46647PAR73 | USD 100.68 | 4.75 | 2.73 | -1.92 |
a) Largest bank in the world by market cap b) CET1 (Common equity Tier 1) ratio at 14.3% in 1Q26. Down 0.2% from 4Q25. Attention: c) Senior Unsecured bond, with respect to the exercise of US bail-in power. d) Resettable features. | ||||||
Bank of America
| BAC 2.087% | US06051GJZ37 | USD 98.14 | 4.75 | 2.39 | -1.36 |
a) The 2nd largest bank, globally, majoring in commercial banking, wealth management and investment banking b) CET1 ratio at 11.2% in 1Q26. Down 0.2% from 4Q25. Attention: c) Senior Unsecured bond, with respect to the exercise of US bail-in power. d) Resettable features. | ||||||
UBS AG | UBS 5.428% | USH42097EV54 | USD 100.87 | 5.04 | 2.24 | -2.33 |
a) One of the most well-established and influential banks globally. Foremost bank in Switzerland, focusing on wealth management, asset management and investment banking. b) CET1 ratio at 14.7% in 1Q26. Up 0.3% from 4Q25. Attention: c) Senior Unsecured bond, with respect to the exercise of Swiss bail-in power. d) Resettable features. | ||||||
HSBC Holdings | HSBC 4.583% | US404280BT50 | USD 101.33 | 4.85 | 3.04 | -1.88 |
a) Bank giant with unique historical and business links to East Asia and a highly multinational footprint b) CET1 ratio at 14.0% in 1Q26. Down 0.9% from 4Q25. Attention: c) Senior Unsecured bond, with respect to the exercise of UK bail-in power. d) Resettable features. | ||||||
BNP Paribas | BNP 5.27% | FR001400JF24 | USD 101.23 | 4.88 | 3.04 | -1.61 |
a) Flagship bank in France, 2nd largest bank in Europe by asset. b) CET1 ratio at 12.8% in 1Q26. Up 0.2% from 4Q25. Attention: c) Senior Preferred bond, with respect to the exercise of France bail-in power. d) Resettable features. | ||||||
Standard Chartered
| STANLN 4.299% 13 Jan 2030 | XS3258535908 | USD 98.23 | 5.10 | 2.19 | -1.76 |
a) Prominent international banking group with a strong presence across Asia, Africa, and the Middle East. b) CET1 ratio at 13.4% in 1Q26. Down 0.7% from 4Q25. Attention: c) Senior Unsecured bond, with respect to the exercise of UK bail-in power. d) Resettable features | ||||||
National Australia Bank | NAB 4.308% 13 Jun 2028 | US632525CJ86 | AUD 98.42 | 5.07 | 3.31 | -0.37 |
a) Australia’s largest business bank (“Big Four”) b) CET1 ratio at 11.48% in 1Q26. Down 0.22% from 4Q25. Attention: c) Senior Unsecured bond | ||||||
FWD Group Holdings
| FWDGHD 7.784% 6 Dec 2033 | XS2730013104 | USD 111.4 | 5.83 | 5.51 | -4.58 |
Hong Kong–headquartered life insurer operating across 10 Asian markets, including Hong Kong, Singapore, Japan, Thailand, Indonesia, and the Philippines, serving over 34 million customers with diversified life, health, and general insurance products. | ||||||
Westpac Banking Corporation
| WSTP 5.151% 12 Feb 2031 | AU3CB0331148 | AUD 100.21 | 5.09 | 3.96 | n.a. |
a) Headquartered in Sydney and Australia’s oldest bank (“Big Four”) b) CET 1 ratio at 12.42% in 1H26. Up 0.18% yoy. Attention: c) Senior Unsecured bond | ||||||
Source: Bloomberg. All prices and yields are indicative and for reference only. Please contact the UOB Kay Hian product team for more information.
We also offer regular updates on selected bonds from the Bond Radar above. The month’s Bond Highlight is on:
BABA 4.875% 26 May 2030
About the Issuer
Alibaba Group Holding Limited (BABA / 9988 HK) is China’s largest e-commerce operator, a major hyperscaler and a full stack AI leader globally. Its businesses span online retail, cloud computing, core AI technologies, logistics and financial services. As of September 3, 2026, BABA has an equity market cap of USD 273bn and cash on hand of USD 57bn. The company has USD 26.88bn of bonds outstanding, with an average maturity of 10 years and an average fixed coupon of 2.92% (Bloomberg).
Investment Thesis
- Full stack AI leadership. Alibaba owns a comprehensive AI ecosystem encompassing cloud services, AI models, application suites, and custom-designed chips. To cement its technological leadership, the company has committed RMB 380 bn (USD 56 bn) in capex over the next three years – one of the highest in China and more than its total capex over the past decade combined. and full stack advantage. Click here for more information on BABA’s full stack advantage.
- Heavy capex as a key credit concern. The heavy capex is a double-edged sword for Alibaba, as in the case for all hyperscalers. Its capex surged 75% yoy to RMB 67.7bn and pushed free cash flow to negative RMB 44.7bn in 1QFY2027, compared with a negative RMB 18.8bn a year earlier.
- Substantial capex unlocks significant monetization potential. On the upside, BABA has already deployed around half of its RMB 380bn three-year AI capex plan. Management estimates AI compute investments have a three-year payback period currently, which could shorten as capacity utilization, proprietary chip adoption and cloud margin continue to improve.
- Key risk remains the return on AI investments (ROI). The main risk is that AI capex remains elevated for longer than expected without sufficient monetization, resulting in prolonged earnings downside and negative free cash flow. UOBKH recently lowered FY2027 earnings estimates by 6.6% due to increasing AI spending. Having said that, Alibaba’s financials remain reasonably healthy for now (see below).
Financial Highlights (1QFY2027)
- Operating cash flow to interest expense: 9.75x. The strong interest coverage indicates comfortable debt-servicing capacity despite elevated capex.
- Free cash flow (FCF) to total debt: -17.33%. The negative FCF reflects BABA’s heavy AI and cloud infrastructure capex as a toll on its cash flow. FCF key is a key credit metric to monitor.
- Net debt / EBITDA: 5.72x. Leverage appears high on this measure, largely reflecting the current investment cycle. Sustained earnings growth and capex monetization are crucial to deleveraging.
- Current ratio: 1.36x. Current assets sit comfortably above short-term liabilities, indicating solid near-term liquidity and adequate working capital buffer.
- Return on invested capital (ROIC): 1.44%. Current low returns reflect the significant upfront investments in AI, which should improve as its AI business continues to scale and deliver higher margins.
Macro Comments
We track the following US economic data to understand the Fed policy and interest rate changes. We then selectively comment on a few of the indicators, those that we deem the most relevant.
Inflation | Consumption | Production | Labor Market | GDP | Fed |
CPI & Core CPI | Consumer Sentiment Index | Manufacturing PMI | Jobless Claim | GDP | FOMC meeting |
PPI & Core PPI | Consumer Credit | Service PMI | Job Openings | GDPNow (est.) | Fed Speeches |
PCE & Core PCE | PCE Consumption | New Orders | Non-farm Payroll |
| FedWatch |
| Retail Sales | Freight Index | Unemployment |
| Prediction Market |
|
|
| Wage Growth |
| FOMC meeting |
Key Conclusion: On the dovish side, US consumption is showing signs of fatigue, and manufacturing data also began to decelerate. On the hawkish side, the latest blowout labor market data was surprisingly robust, reinforcing the Fed’s hawkish stance. The upcoming inflation print (CPI) on Sep 11 should be the data Wall street has been waiting for to finalize the estimation of rate path ahead.
- Labor market data (August Non-farm Payroll). The latest NFP came in at 162K, nearly tripling the consensus forecast of 56K, as unemployment held steady at 4.1%. Market reactions were largely hawkish: FedWatch’s probability for a September rate hike increased from 50% to 60%, while gold declined by 1%, the Dollar Index gained 0.2%, and 10-year Treasury yields rose slightly by 4 bps.
- Inflation (July CPI and PCE). July’s inflation print was mixed, as the headline moderation masked underlying stickiness. Headline CPI cooled to 3.4%, while Core CPI moderated to 2.5% yoy – better than expected and alleviating rate hike fears. On the producer side, PPI cooled meaningfully to 5.5% yoy (from 6.6% in June), with Core PPI edging down to 3.6%. However, Core PCE, Fed’s preferred matric to gauge inflation, held firm at 3.3%, slightly above the expected 3.2%, indicating hurdles of the "last mile" before achieing disinflation.
- Production (August Manufacturing/Service Index). The ISM Manufacturing Index declined 1.0pt to 54.6 in August, missing expectations with weak internals across new orders, production, and employment. Conversely, the ISM Services Index defied broader cooling trends, rising 1.3pt to 55.4 on strong new orders, business activity, and employment components hitting multi-year highs. Generally softening manufacturing data, a 0.5% drop in nominal construction spending, and a downward revision in the S&P Global Services PMI all cast a shadow on broader industrial growth into 2H2026.
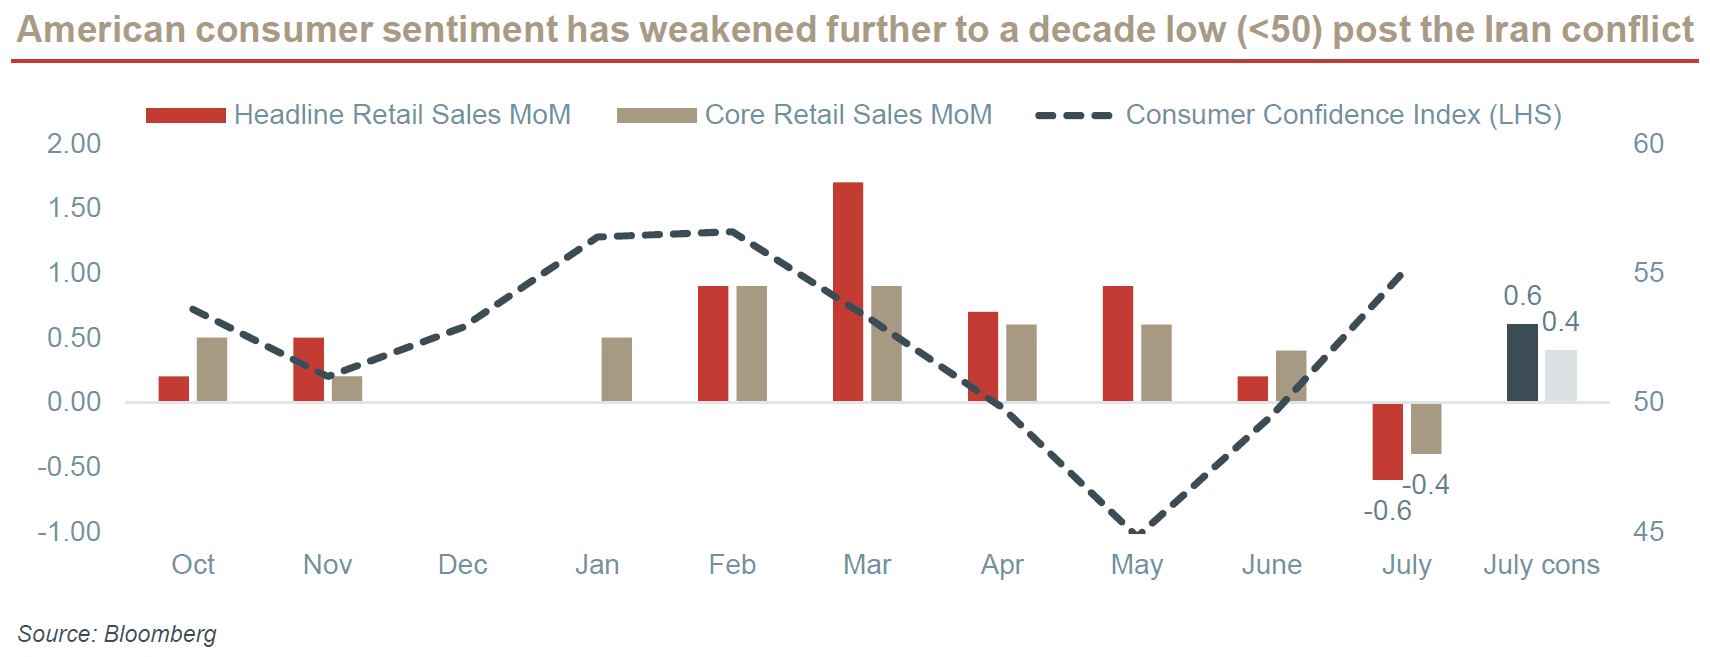
- Consumption (July retail and August consumer confidence). US consumers, the primary engine of GDP expansion, begin to show signs of fatigue. Headline and core retail sales contracted by 0.6% and 0.4% mom respectively, marking the first monthly decline this year. This is also a sharp miss against consensus expectations of positive growth MoM. While some weaknesses can be attributed to calendar distortions (i.e. Amazon Prime Day), the structural underpinnings related to fading fiscal tailwinds are concerning. For example, the consumption boost from OBBBA-facilitated tax refunds (which was +17% yoy) has been largely absorbed, leaving limited upside for 2H2026. On sentiment, the UMich Consumer Sentiment Index fell again to 51.7 in August, now barely above the 50 benchmark, confirming that consumer confidence remains fragile amid ongoing inflation and rate concerns.
Fed vs Treasury: Two Drunken Sailors Tied by a Tether
Recent actions and comments by Treasury Secretary Scott Bessent and Fed Chair Kevin Warsh have sparked much controversy, confusion, and even criticism. Simply saying markets will become more volatile would be insufficient. Let’s unpack the likely sources of this volatility to help you better prepare for what lies ahead.
- Two “drunken sailors” on different routes. Needless to say, Treasury and the Fed have fundamentally different mandates, philosophies and policy frameworks. While many view both Bessent and Warsh as Trump’s economic lieutenants, they act relatively independently, with no apparent control over each other. This debunks the myth that Treasury and the Fed will simply do whatever Trump asks them to do.
- Tied by a heavy tether. That “independence” comes with a caveat: while Treasury and the Fed are legally separated, their policies can often collide or collaborate depending on the macro environment and prevailing political pressures. Both Bessent and Warsh know that their playbooks can directly interfere with each other, and they must calibrate their moves carefully to manage any cross-currents. There is indeed a structural tether that can align Treasury and Fed interests and enhance policy transmission, yet also cause conflicts that restrict the effectiveness of unilateral actions.
Category | Treasury | The Fed |
Current Philosophy | Pragmatic intervention, supply-side duration management, and economic nationalism | Reduced forward guidance (Fed signaling), market discipline above intervention, AI as a structural productivity driver (long-term positive) |
Mandates | Economic growth & fiscal solvency: debt management, collecting revenue, financial stability, and promoting US competitiveness | Dual-Mandate: price stability (inflation target) and maximum sustainable employment |
Target Variables | 3-3-3 strategic targets: 3% real GDP growth, budget deficit at 3% of GDP, and oil production rising by 3mn barrels/day. | PCE inflation (~2% target), unemployment under control. |
Primary Tools | Debt issuance management, FX interventions, Treasury General Account (TGA) management, tax code enforcement, emergency credit facilities, sanctions (OFAC), etc. | Federal Funds Rate (policy rate), Quantitative Easing & Tightening (QE/QT), Liquidity Facilities (Discount Window, SRF), Reserve Requirements (IORB/ON RRP rates), etc. |
- More conflict than harmony…for now. Today, Bessent and Warsh not only hold different core philosophies, but also have diverging policies that may work against each other. For example, Bessent recently doubled long-bond buybacks – funded by increased short-term T-bill issuance, while Warsh struck a distinctly hawkish tone at Jackson Hole, implying that he may raise rates soon to combat inflation.
- Still higher certainty at the short-end vs. the long-end. Despite policy frictions between Treasury and the Fed, the short end remains more liquid and predictable at this juncture. Warsh’s plan to shrink the Fed’s USD 7trn balance sheet may entail a structural shift toward short-term bills, helping to digest Bessent’s increased supply at the short end. The long end, however, is far more complex: the Fed unwind, elevated oil prices, rising AI funding demand, US fiscal concerns and bond vigilantes can all push yields higher, making Bessent’s strategy less effective.
- Two drunken sailors tied by a tether. Allow us to bring back our very first point: Treasury and the Fed may be sailing on divergent routes for now, but they are still bound by a “tether” that works both ways. At the end of the day, the ultimate forces aligning their interests include the domestic economy, market stability and policy credibility. Therefore, if all works out, there will be periods of smooth sailing from here when Treasury and the Fed will be in perfect sync. Before then, plenty of volatility ahead.
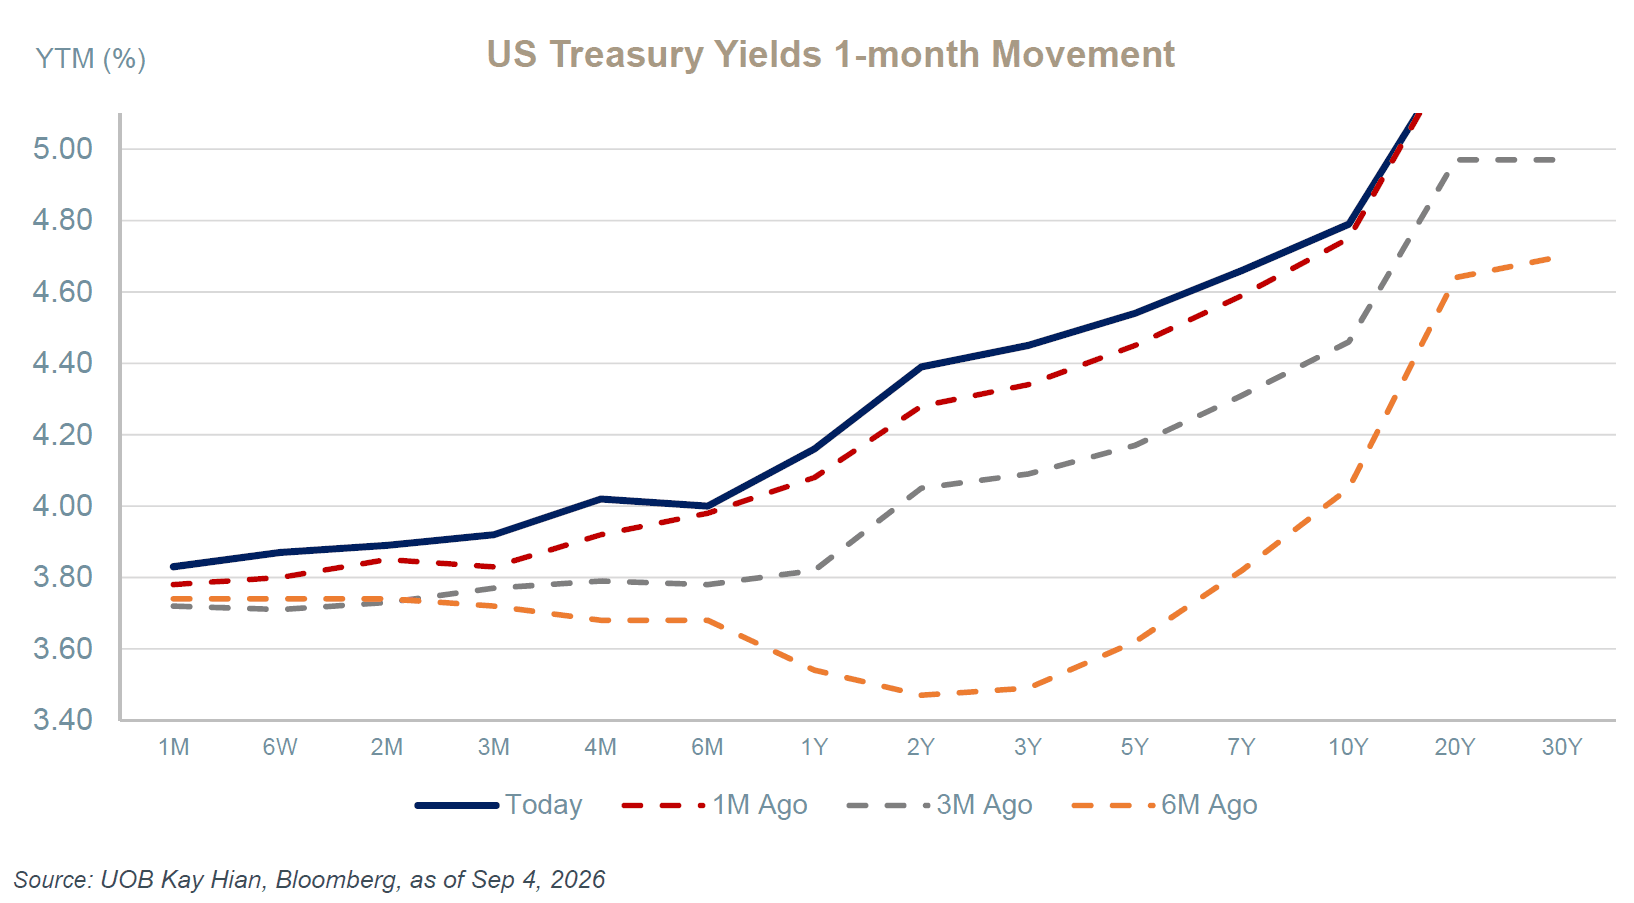
US yield curve shifts higher across all tenors
Credit View
US Credit: AI Financing Reshapes Investment-Grade Outlook
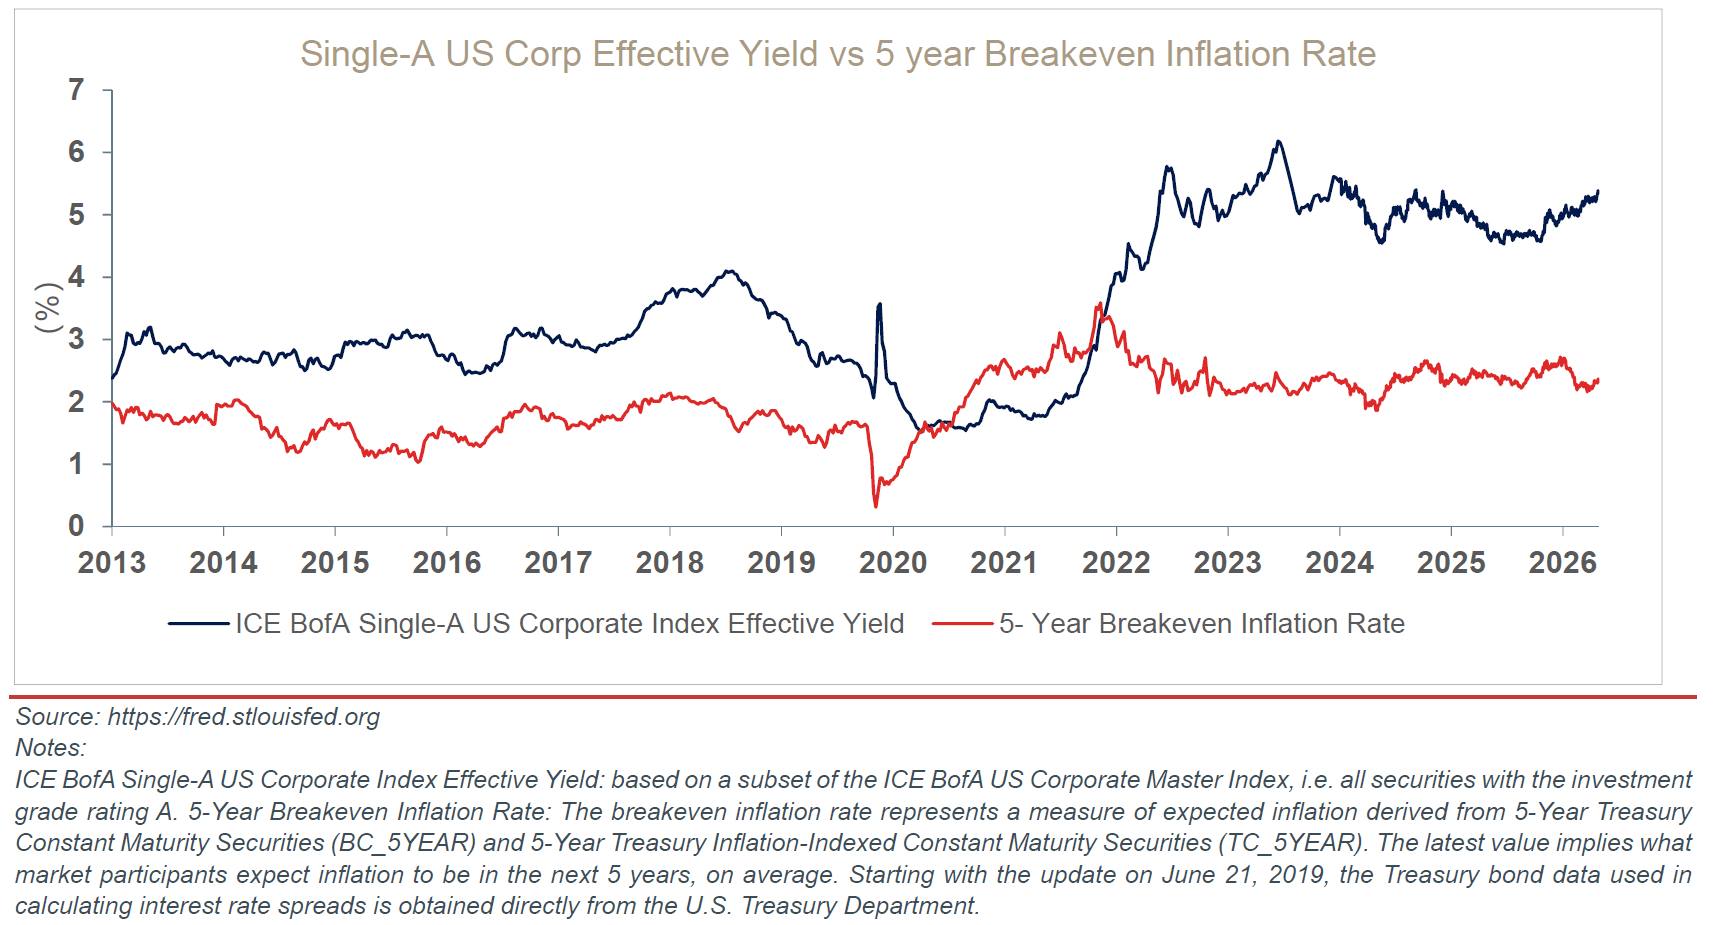
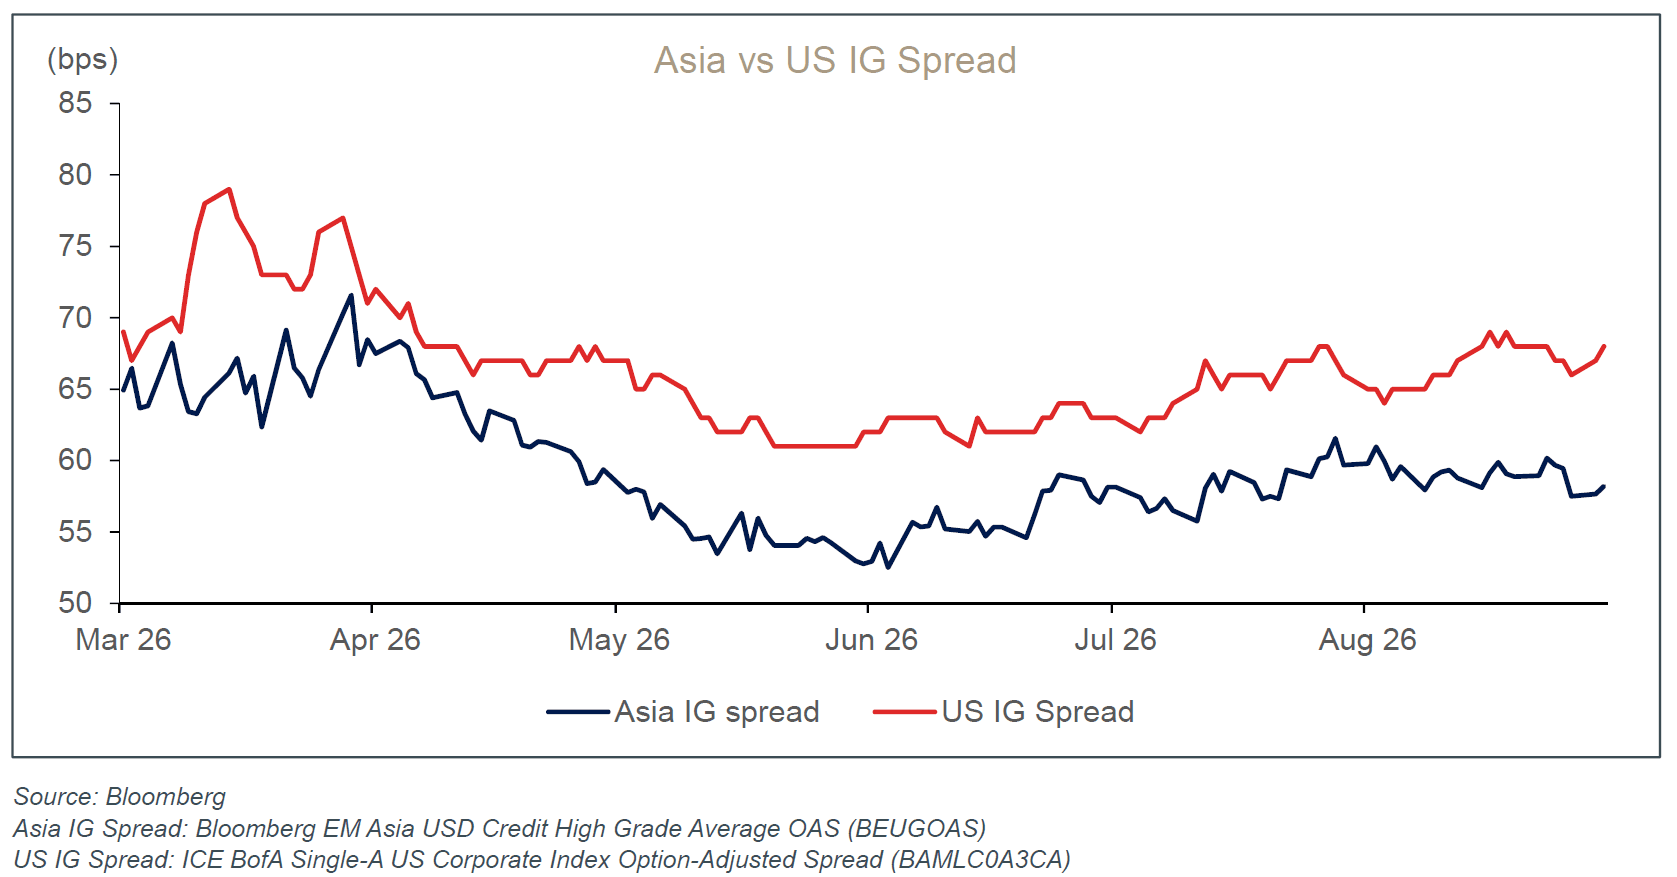
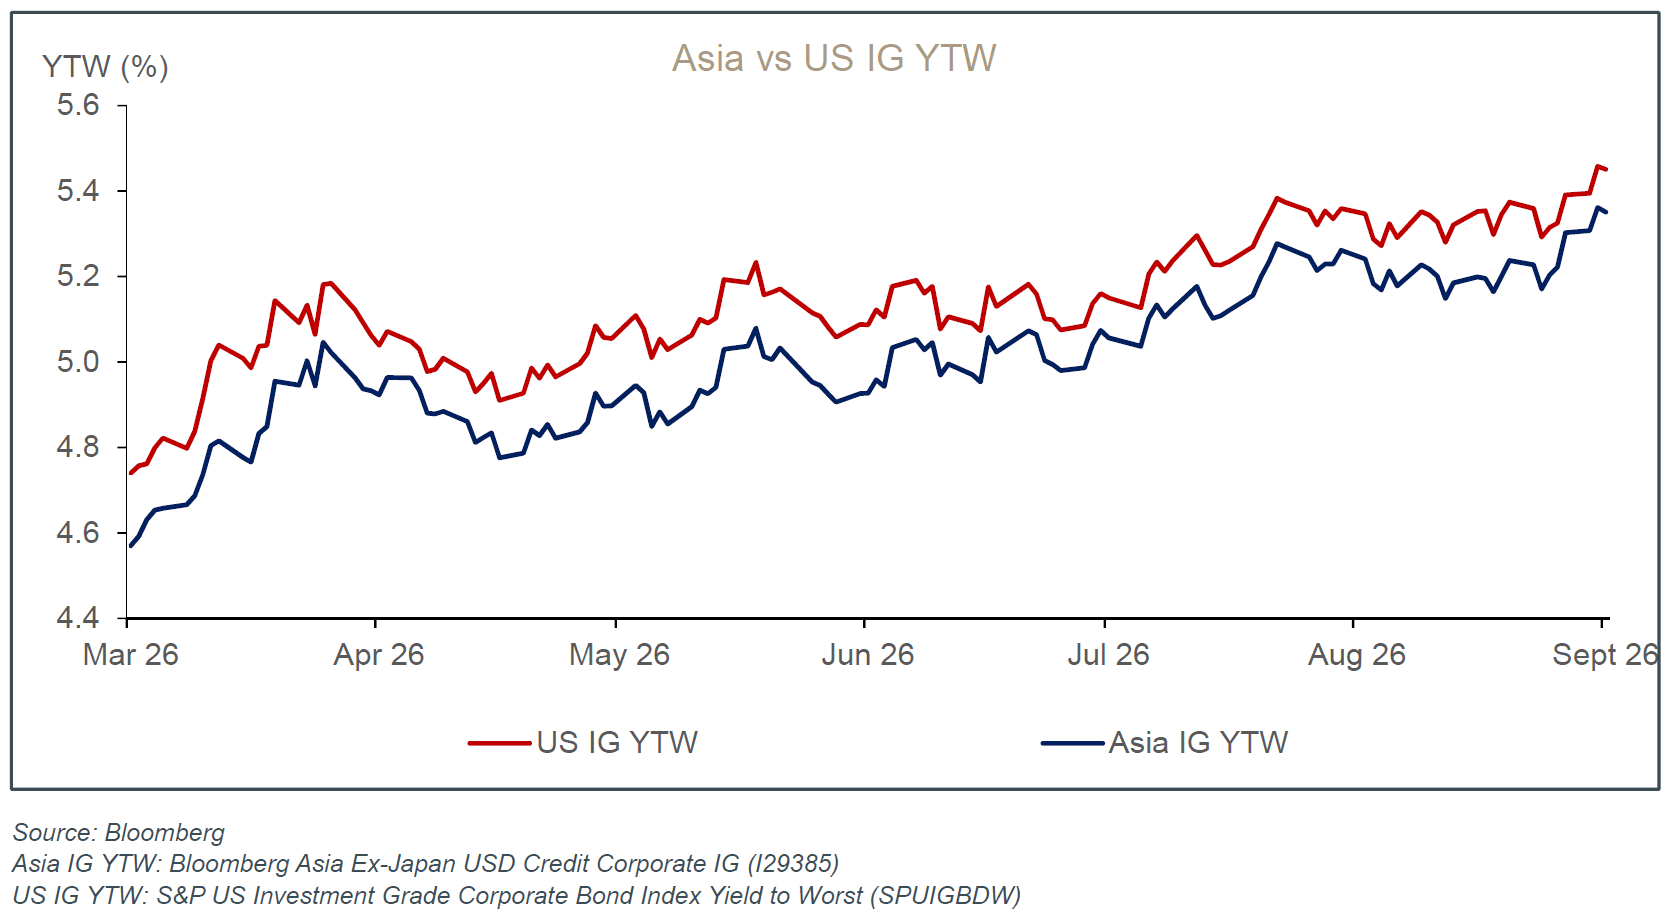
The US credit market enters September with a broadly constructive backdrop, as corporate earnings and balance sheets remain supportive, and default activities are contained and well below levels typically associated with late-cycle deterioration. Meanwhile, credit spreads remain close to historically tight levels and the higher-for-longer rate environment limits any potential contribution from further spread compression, suggesting that carry and income should remain the primary drivers of returns.
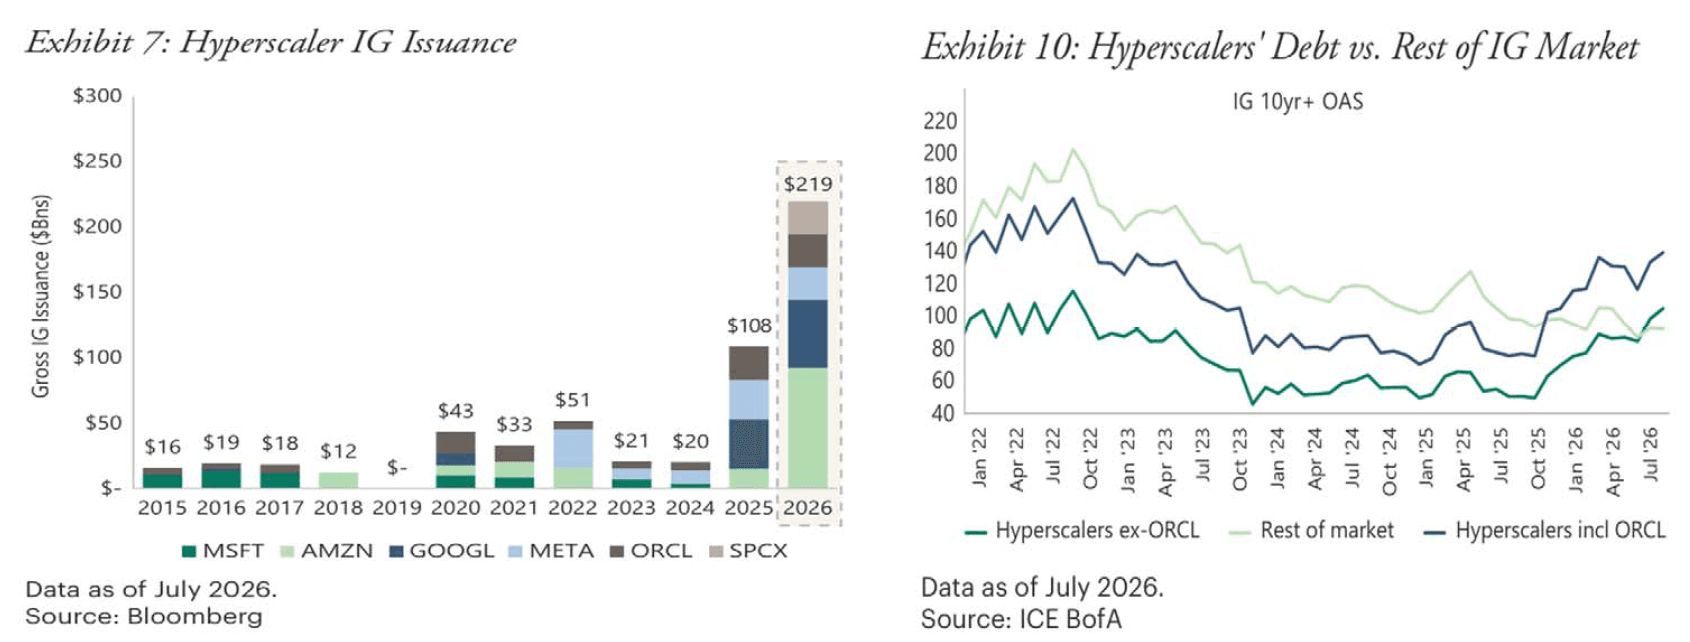
The AI investment cycle remains an important structural change for the credit market. Net US IG issuance is approaching USD 1tn in 2026, as Amazon, Alphabet, Microsoft, Meta, Oracle and SpaceX have collectively issued more than USD 200bn to fund their AI investments. As repeated AI-related issuance increases portfolio concentration and supply pressure, investors are likely to demand greater compensation – particularly from frequent issuers and at longer maturities.
AI financing is also expanding beyond the USD market, as showcased by Alphabet’s inaugural AUD Kangaroo bond. In August, Alphabet raised AUD 5.5bn (around USD 3.9bn) – the largest AUD corporate bond transaction on record. The six-tranche senior unsecured deal included fixed- and floating-rate 3- and 5-year bonds, together with fixed-rate 10- and 20-year maturities. Final pricing was set at BBSW/swap +65bp for the 3-year tranches, +90bp for the 5-year tranches, +133bp for the 10-year bond and +180bp for the 20-year bond, with fixed coupons ranging from 5.20% to 6.90%. Demand was strong, with final orders exceeding AUD 18bn, or roughly 3.3 times the issued amount. The transaction highlights both the depth of demand for scarce, high-rated technology credit in Australia and the ability of hyperscalers to diversify funding across non-USD markets.
We remain overall constructive on US credit but see limited value from a further broad-based spread compression. We continue to favour short-duration (<3 years), higher-quality investment-grade corporate bonds.
Asia Credit: Selectivity Rises as AI Funding Diverges
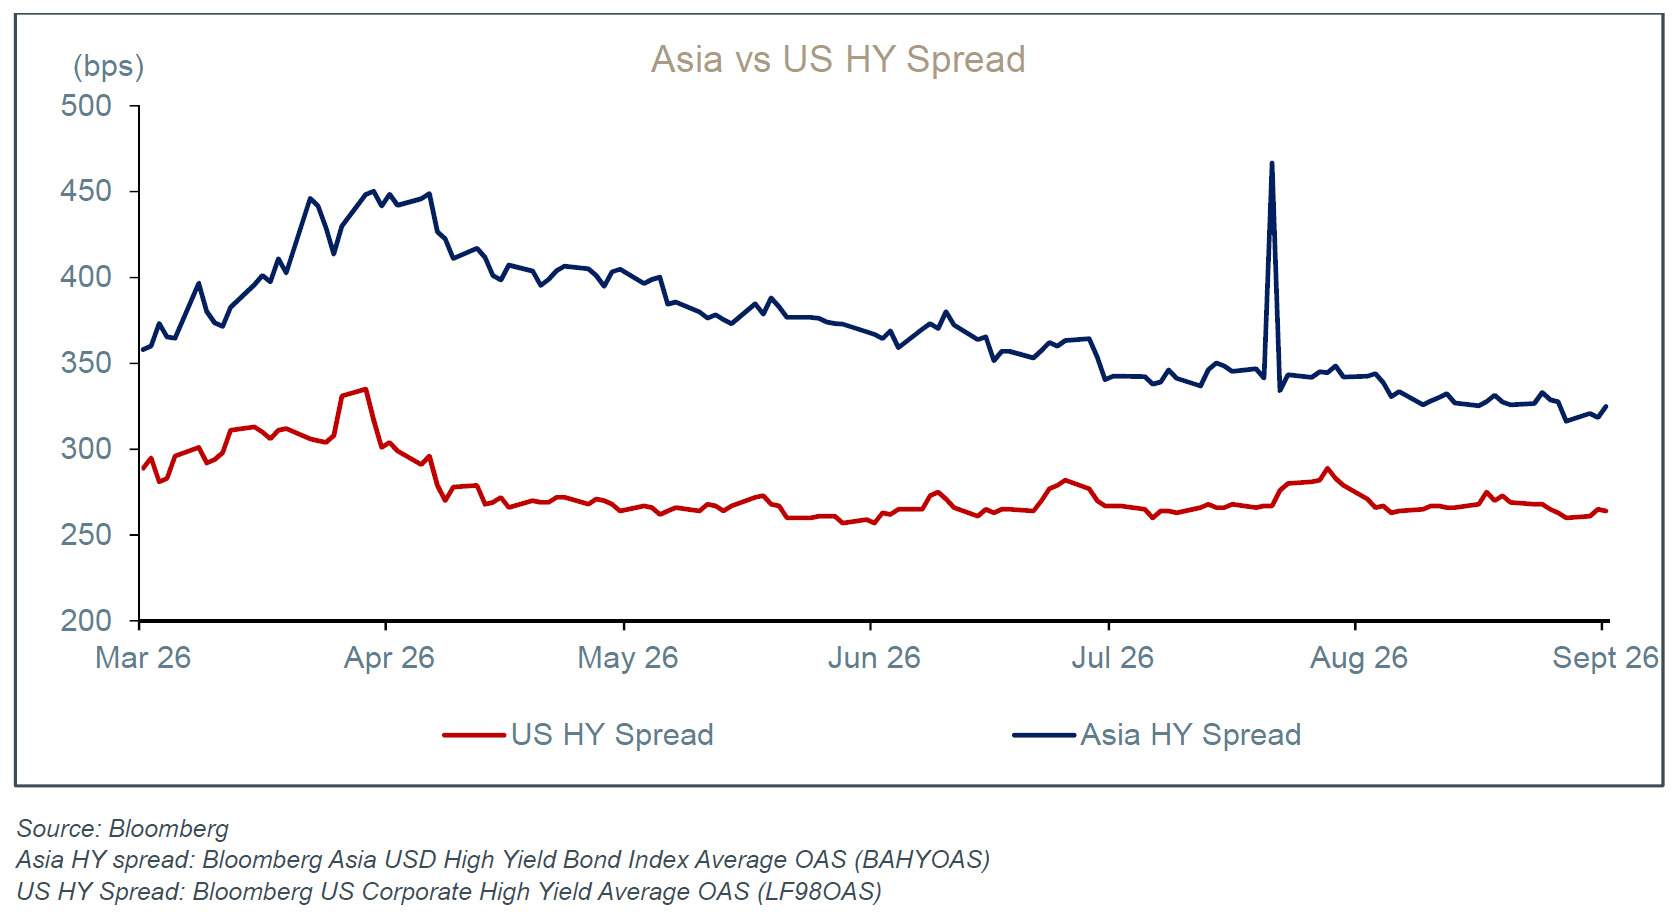
Asia credit enters September with fundamentals broadly intact, although tight valuations offer less room for disappointment. The JP Morgan Asia Credit Index (JACI) remained at around 88bps into late August, with recent returns driven more by lower Treasury yields than further spread compression. We continue to see carry, rather than aggressive spread tightening, as the main driver of returns.
Chinese technology has become an increasingly important source of dispersion within Asia IG. China’s leading internet firms are expected to commit more than USD 325bn to AI and related capex through 2030, and the sheer scale of investment is increasingly pressuring free cash flow. Alibaba’s HKD 80bn equity placement highlighted the funding need, as its sizeable AI investment programme and declining net-cash position suggest greater reliance on external financing, which could keep its bonds sensitive to future supply. Tencent remains better positioned thanks to its more pragmatic approach to AI investment, stronger recurring cash generation and diversified gaming and advertising revenues, although elevated AI capex has also weakened free cash flow temporarily. Baidu has weaker internal cash generation but greater flexibility to use bank borrowing, leasing and financing through its AI-chip subsidiary. As you can see, China technology is not a broad downgrade story, but rather a sector with divergent credit profiles and duration-based repricing risks.
SK Hynix represents the other side of the AI credit story. While hyperscalers like Alibaba are investing heavily in AI infrastructure, Hynix is directly benefiting from increasing spending on high-bandwidth memory (HBM), advanced DRAM and enterprise SSDs – key components for building AI data centers. Bloomberg Intelligence expects its 2027 operating profit to exceed consensus by around 10-11%, supported by robust HBM demand and higher memory pricing. The earnings strength is translating directly into stronger credit metrics. As a result, S&P upgraded Hynix from BBB+ to A-/Positive in August, following Moody’s earlier upgrade to A3. This is in sharp contrast to increasing credit concerns over the hyperscalers, i.e. capital spenders. The moral of our Hynix story is clear: investors should differentiate between companies paying for AI investments and those earning from them by supplying key components.
We remain overall constructive on Asia credit, but recommend a more selective approach. We favour high-quality Asia IG, shorter to intermediate-duration carry, defensive financials and issuers directly benefiting from AI investment growth such as SK Hynix. Meanwhile, we are more cautious on long-dated Chinese hyperscaler bonds where AI capex is weakening free cash flow for now, richly valued senior financials, and issuers with persistent external funding requirements.
Asia Pacific Key Sovereign Rates Monitor
Region | 2 Year | 5 Year | 10 Year | 30 Year |
Australia | 4.77 | 4.79 | 5.17 | 5.64 |
China | 1.21 | 1.39 | 1.68 | 2.16 |
China (usd) | NA | NA | NA | NA |
India | 6.24 | 6.45 | 6.96 | 7.54 |
Indonesia | 6.62 | 6.90 | 7.10 | 7.18 |
Indonesia (USD) | 4.23 | 5.10 | 5.71 | 6.03 |
Japan | 1.83 | 2.26 | 2.94 | 4.05 |
Malaysia | NA | 3.53 | 3.91 | 4.28 |
New Zealand | 3.58 | 4.18 | 4.76 | 5.42 |
Pakistan | NA | 11.76 | 12.12 | NA |
Philippines | 6.06 | 7.02 | NA | NA |
Philippines (USD) | 4.37 | 4.90 | 5.61 | NA |
Singapore | 1.68 | 2.01 | 2.36 | 2.44 |
South Korea | 3.66 | 4.10 | 4.35 | NA |
South Korea (USD) | 4.22 | 4.37 | NA | NA |
Taiwan | 1.67 | 1.82 | 1.85 | 2.09 |
Thailand | 1.15 | 1.60 | 2.19 | 3.18 |
Source: Bloomberg, as of Sep 3, 2026
Credit Spreads
Credit Yields
Bond ETF and Fund Radar
Key Risks for Investing in Bond Funds
- Market risk: Bond prices can fall due to rising interest rates, widening credit spreads, economic slowdowns, or issuer-specific issues.
- Currency risk: FX movements can significantly affect returns.
o Stronger USD boosts unhedged foreign holdings in SGD terms.
o Weaker USD can offset or even reverse bond gains.
- Hedged share classes: Many funds offer SGD, EUR, AUD, HKD, or CNH-hedged classes to reduce FX volatility and focus on credit and duration exposure.
High-Yield Exposure
- Global bond funds may hold both investment-grade and high-yield bonds.
- High-yield bonds carry higher default, macro, and liquidity risks.
- This means greater price volatility and potential capital losses, especially if the exposure is unhedged in a weakening currency.
Key Considerations
- Past performance is not indicative of future results.
- Yield alone should not drive investment decisions.
- If diversifying away from USD amid de-dollarisation trends, compare:
o Hedged share classes
o Hedging costs
o Overall risk–return profile
Bond ETF and Fund Radar: Key Facts
Name | Category | Duration Type | Expense | Effective Duration | Average Yield | Credit Quality |
Vanguard Short-Term Corporate Bond ETF (VCSH US) | Investment Grade ETF | Short | 0.03% | 2.7 | 5.00% | 54.79% in A rated and above 45.23% in BBB rated Average Quality – A- |
iShares Core U.S. Aggregate Bond ETF (AGG US) | Investment Grade ETF | Intermediate | 0.03% | 5.78 | 5.06% | 87.89% in A rated and above 11.56% in BBB rated Average Quality – AA |
iShares iBoxx $ Investment Grade Corporate Bond ETF (LQD US) | Investment Grade ETF | Long | 0.14% | 7.71 | 5.72% | 59.36% in A rated and above 39.87% in BBB rated Average Quality – A- |
HSBC Short Duration Bond Fund | Investment Grade UT | Short | 0.70% | 2.57 | 4.90% | 43.49% in A rated and above 44.75% in BBB rated 10.32% in HY Average Quality – A-/BBB+ |
PIMCO GIS Income Fund | Investment Grade UT | Intermediate | 1.45% | 6.73 | 7.32% | 80.60% in A rated and above 9.90% in BBB 9.20% in HY Average Quality – AA- |
Fidelity US Dollar Bond Fund | Investment Grade UT | Long | 1.03% | 6.6 | 5.03% | 81.18% in A rated and above 12.84% in BBB 2.33% in HY Average Quality – AA- |
Source: Bloomberg, MorningStar, iShares and Vanguard as of Sep 3, 2026. US listed ETFs might subject investors to a 30% withholding tax on all dividends received. Please consult your tax consultant for further information.
Bond ETF and Fund Radar (continued): Performance Data
Fund Name | ISIN / Ticker | Currency | 1 Month Total Return (%) | YTD Total | 1 Year Total Return (%) |
HSBC GIF Global Short Duration Bond Fund | LU1163226092 | USD | 0.03 | 1.48 | 3.06 |
LU1272399756 | SGD | -0.20 | -0.27 | 0.28 | |
LU2639850283 | EUR | -0.09 | 0.29 | 1.10 | |
PIMCO GIS Income Fund | IE00B7KFL990 | USD | -0.22 | -0.17 | 2.78 |
IE00B9HH6X13 | SGD | -0.38 | -1.87 | 0.04 | |
IE00B84J9L26 | EUR | -0.35 | -1.32 | 0.85 | |
Fidelity Funds - US Dollar Bond Fund | LU0261947682 | USD | -0.22 | -1.75 | -0.33 |
LU2605879787 | SGD | -0.47 | -3.46 | -3.11 | |
LU2730164063 | EUR | -0.34 | -2.93 | -2.29 | |
Vanguard Short-Term Corporate Bond ETF (VCSH US) | VCSH US | USD | 0.02 | 0.94 | 2.58 |
iShares Core U.S. Aggregate Bond ETF (AGG US) | AGG US | USD | -0.09 | -0.41 | 1.56 |
iShares iBoxx $ Investment Grade Corporate Bond ETF (LQD US) | LQD US | USD | -0.30 | -1.39 | 0.55 |
Bloomberg US Aggregate Total Return Index | LBUSTRUU Index | USD | -0.04 | -0.49 | 1.60 |
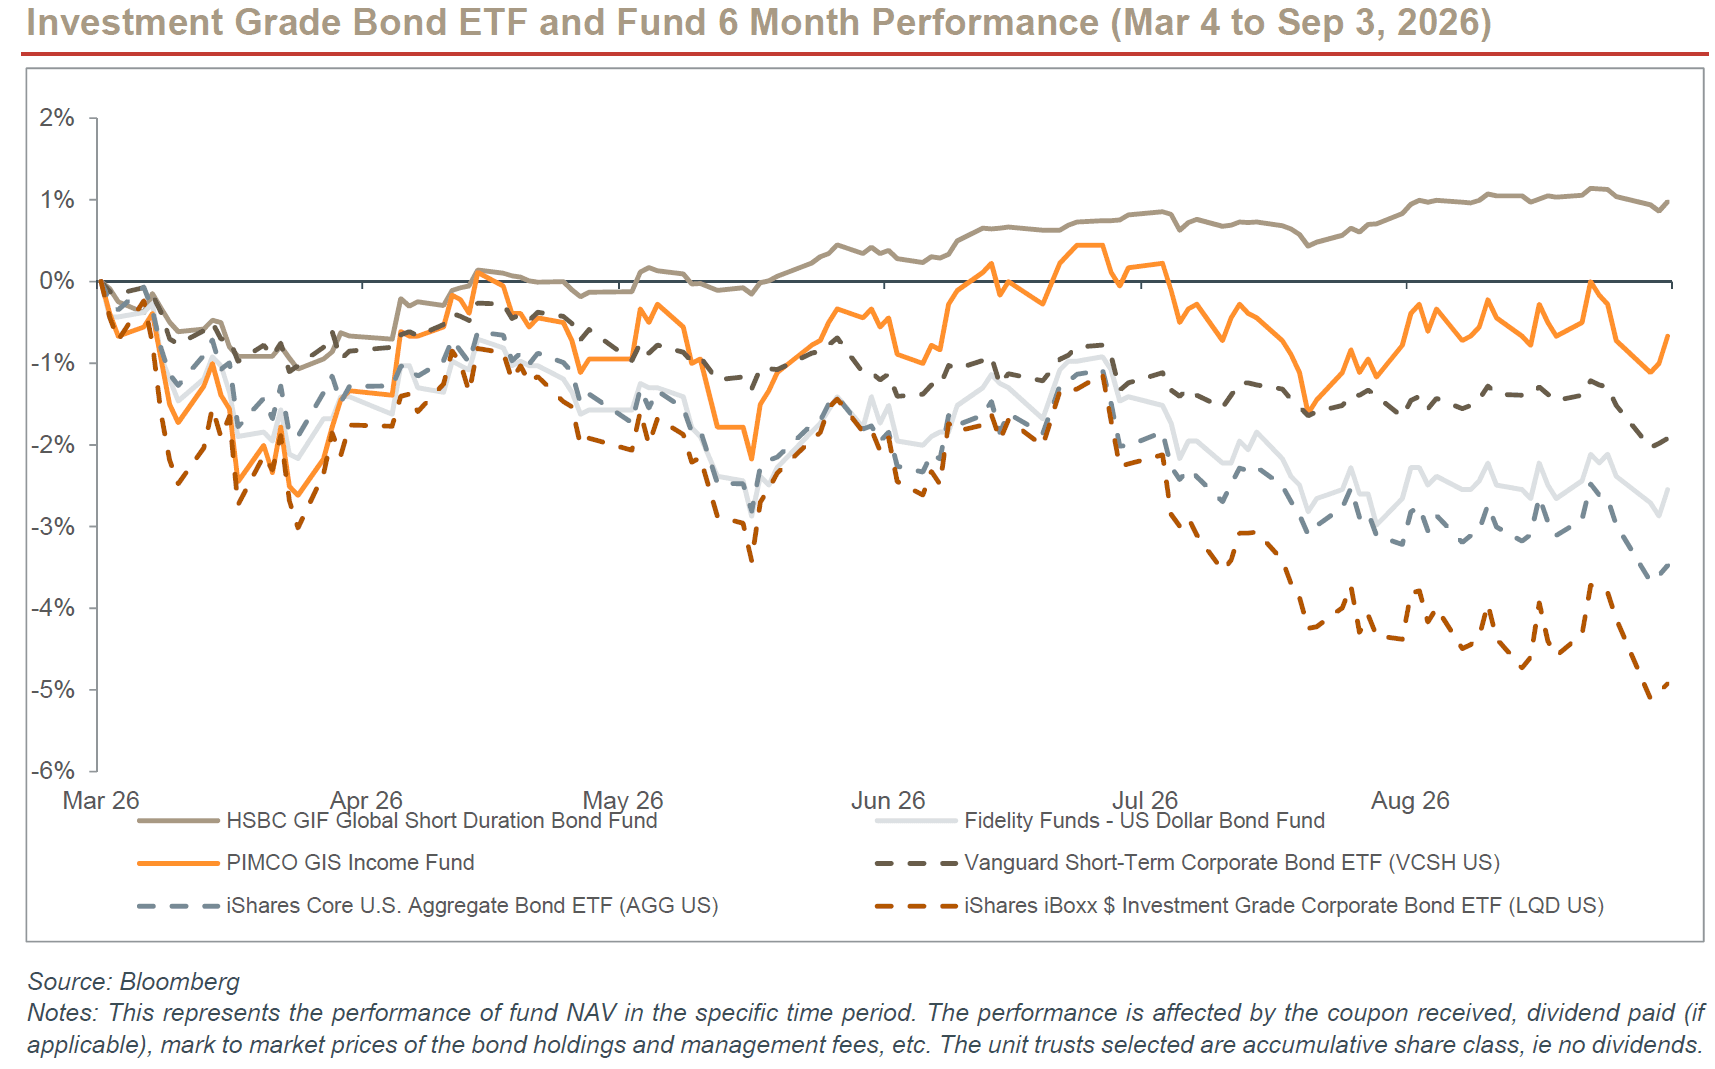
Source: Bloomberg as of Sep 3, 2026. Based on the accumulative share class for unit trust (no fund dividends) and dividend reinvestment for ETF.
Glossary
Average Coupon: the weighted average of the various coupons of a bond portfolio.
Average Credit Quality: the weighted average of each bond’s credit rating in a portfolio. See Average Rating below.
Average Duration: the sensitivity of the value of a bond portfolio to interest rate changes. The longer the duration, the more sensitive toward interest rate changes.
Average Rating: the weighted average rating of all bonds in a portfolio. For example, a portfolio with 25% in AAA, 25% in BBB and 50% CCC bonds would have a weighted average credit rating of B+, which is between BBB and CCC.
Average Yield To Maturity: the rate of return required for the present value of all the future cash flows of a bond portfolio to equal the current bond price.
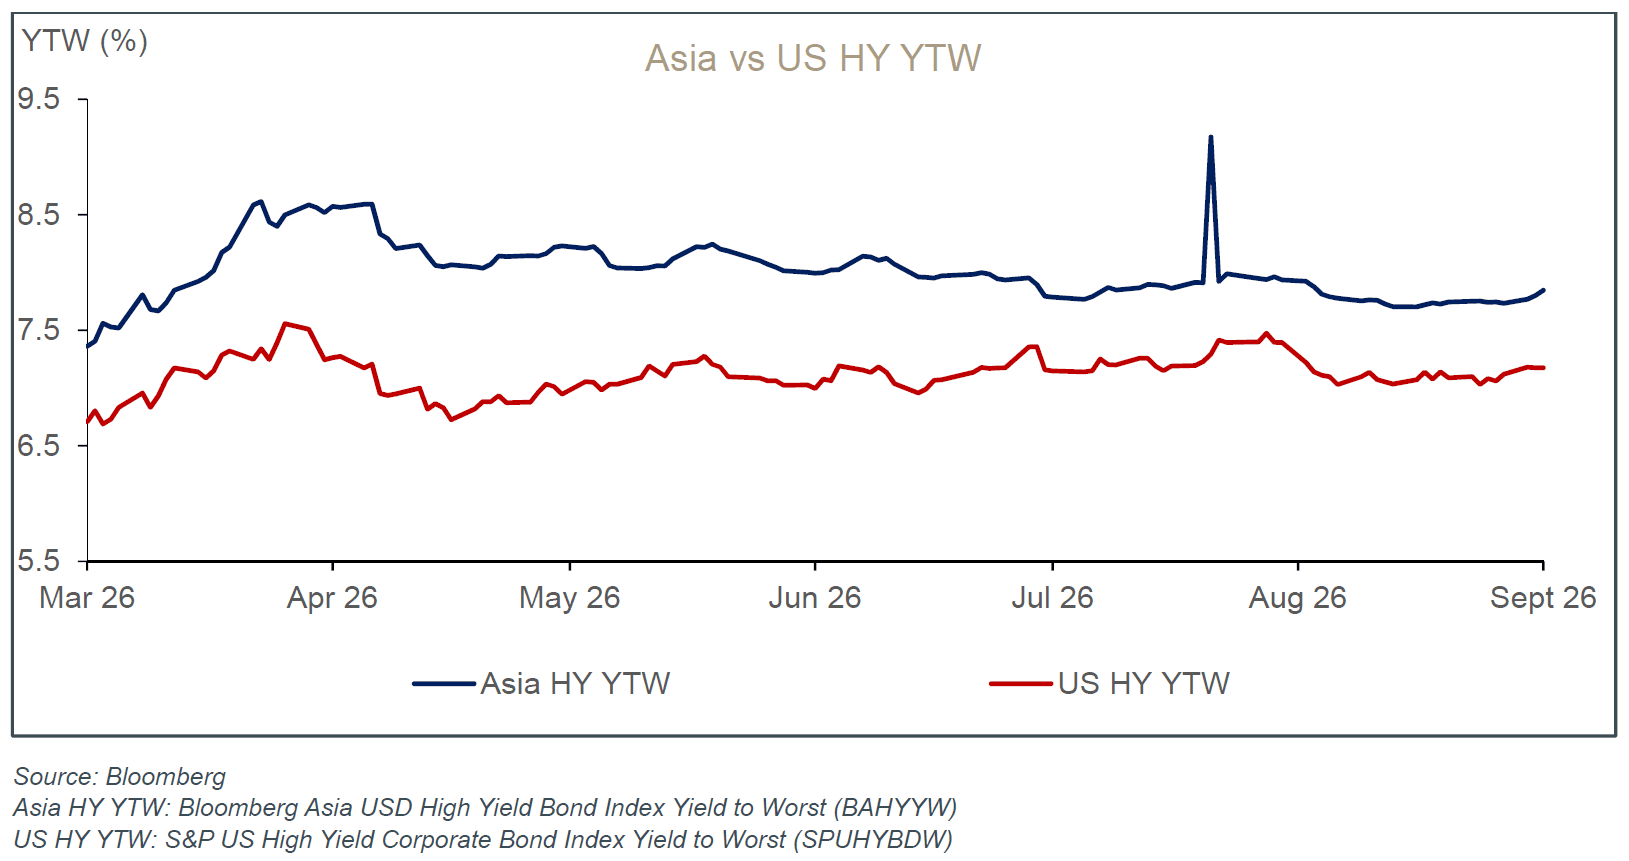
Yield To Worst (YTW): a measure of the lowest possible yield on a bond that fully operates within the terms of its contract without defaulting. It is based on the earliest call or retirement date, assuming that a prepayment of principal occurs if a bond issuer uses the call option.
Effective Duration: see Average Duration above.
Effective Maturity: the date used in place of the final maturity for bonds with call, put or prepayment features.
Running Yield: coupon divided by a bond portfolio’s market price. This is different from Yield to Maturity as the Running Yield does not take into account if the bond market price is below or above Maturity redemption value.
FOR PROFESSIONAL INVESTORS OR ACCREDITED INVESTORS OR RELEVANT PERSON (CKA) ONLY
CIO Summary
- Labor market strength keeps December hike in play. The latest labor market data remain surprisingly resilient, supporting the Fed’s hawkish stance. We continue to believe that a December rate hike is more likely than a September one.
- Fed vs. Treasury: two drunken sailors on different routes. Treasury Secretary Bessent and Fed Chair Warsh seem to be pursuing divergent policies right now, creating higher uncertainty at the long-end and reinforcing our preference for the short-end.
- Yet tied by a tether. Bessent and Warsh know that their playbooks can directly interfere with each other, and they must calibrate their moves carefully to manage any cross-currents. That "tether" ensures that neither can go too far without undermining their shared goals. Buying opportunities arise when investors completely write off this tether — but we are not there yet.
- AI-related bond or equity – but not both. Alphabet's inaugural AUD Kangaroo bond highlights the US hyperscaler's ability to diversify funding across non-USD markets. This could become an emerging trend and further expanding AI concentration risk.
- Amid the uncertain macro environment and rising AI concentration risk, we maintain our Core Recommendation on short-duration, high-quality, investment-grade bonds.
- Bond highlight: BABA 4.875% 26 May 2030
Bond Radar
Below is a list of popular investment-grade (IG) bonds curated by our Products Team. These are for reference only and do not constitute our recommendations. For further details, please contact our fixed-income & credit specialist, Benjamin Tan Shun Chao at benjamintan@uobkh.com.
Asia Non-Financial Corporates
Company | Bond Name | ISIN | Current Price (Sep 3) | YTM (%) | Duration (y) | 6M Performance (%) |
Abu Dhabi | TAQAUH 4.375% | XS2600246552 | USD 98.73 | 4.94 | 2.22 | -1.61 |
Abu Dhabi’s government-owned energy and water conglomerate with the world’s largest single-site solar power plant and other renewables. | ||||||
Singtel | STSP 2.375% | XS2046591413 | USD 93.68 | 4.68 | 2.82 | -1.21 |
State-owned telecom. Largest in Singapore, second in Australia (Optus) and India (Bharti Airtel). Invests in 5G, cloud, and cybersecurity. | ||||||
Petronas | PETMK 3.50% 21 Apr 2030 | USY68856AT38 | USD 95.25 | 4.95 | 3.31 | -2.33 |
Malaysia’s fully government-owned national oil company, operating across the entire oil and gas value chain with strong state support, robust cash generation, and a globally diversified asset base. | ||||||
TSMC | TAISEM 4.125% | US872898AG66 | USD 98.69 | 4.66 | 2.43 | -1.59 |
Top semiconductor manufacturer with leading technologies like the first commercial extreme-ultraviolet lithography (EUV). | ||||||
Alibaba | BABA 4.875% | USG01719AK24 | USD 100.01 | 4.87 | 3.33 | -2.94 |
China’s largest e-commerce company with around 50% market share and a growing user base. Leading cloud provider in Asia Pacific. | ||||||
CNPC Global | CNPCCH 2% | XS2179918037 | USD 90.8 | 4.67 | 3.56 | -1.95 |
| China's largest government-owned oil and gas producer and supplier. One of the world's major oilfield service providers and a globally recognized contractor in engineering construction. | |||||
CNOOC FINANCE | CNOOC 2.875% | US12625GAF19 | USD 94.72 | 4.74 | 2.85 | -1.69 |
| China's state-owned and largest producer of offshore crude oil and natural gas. Known for its pioneering deepwater drilling capabilities. | |||||
Meituan
| MEITUA 4.625% 2 Oct 2029 | USG59669AF11 | USD 98.3 | 5.23 | 2.77 | -2.31 |
| Leading Chinese e-commerce platform for local services, offering a wide range of services such as food delivery, travel booking, and entertainment through its app. | |||||
JD.com
| JD 3.375% 14 Jan 2030 | US47215PAE60 | USD 95.75 | 4.76 | 3.11 | -1.93 |
One of China’s largest e-commerce platforms, focusing on high-quality, branded products, and in-house logistics, making it the leader in categories like electronics and home appliances. | ||||||
Xiaomi
| XIAOMI 3.375% 29 Apr 2030 | USY77108AA93 | USD 94.58 | 5.02 | 3.34 | -1.96 |
| Leading Chinese technology company that designs smartphones, smart devices, and IoT products, recently expanding into electric vehicles | |||||
SK Hynix
| HYUELE 4.375% 9 Nov 2030 | USY8085FBZ28 | USD 97.32 | 5.12 | 3.55 | -3.29 |
| SK Hynix is the world’s second-largest memory chipmaker and a key beneficiary of the global AI-driven demand for high-bandwidth memory. | |||||
Singapore Airlines
| SIASP 3.5% | SGXF10397887 | SGD 104.39 | 2.40 | 3.90 | -1.17 |
| Temasek-controlled, Singapore’s flag carrier with a young fleet and robust liquidity, benefitting from quasi-sovereign support. Operating a full-service carrier (SIA) and low-cost carrier (Scoot) across 130-plus destinations. | |||||
MPACT Treasury
| MCTSP 4.25% 29 Mar 2030 | SGXF59943971 | SGD 106.31 | 2.39 | 3.25 | -1.58 |
| Temasek-backed REIT, owning flagship VivoCity and diversified Grade-A assets across Singapore, Hong Kong and North Asia, providing resilient distributions with organic growth upside. | |||||
Starhub
| STHSP 2.48% 08 Jan 2031 | SGXF30667780 | SGD 99.96 | 2.49 | 4.07 | -0.76 |
| Integrated Singapore telco spanning mobile, broadband, pay-TV and enterprise-ICT services, leveraging 5G and digital platforms to stabilise cash flows and reignite growth. Majority-owned by ST Telemedia, a wholly owned Temasek portfolio company. | |||||
Source: Bloomberg. All prices and yields are indicative and for reference only. Please contact the UOB Kay Hian product team for more information.
US & Europe Non-Financials Corporates
Company | Bond Name | ISIN | Current Price (Sep 3) | YTM (%) | Duration (y) | 6M Performance (%) |
Microsoft | MSFT 1.35% | USU59340AK20 | USD 88.17 | 4.60 | 3.81 | -2.28 |
Big Tech leader with businesses in operating system, search engine, cloud computing, and artificial intelligence etc. A combination of stable cash flows and new growth opportunities. | ||||||
Meta | META 4.8% | US30303M8M79 | USD 99.61 | 4.92 | 3.30 | -3.37 |
Previously Facebook, the origin of today's social media trend. With a growing user base of nearly 4 billion (half of the world population). | ||||||
Nvidia
| NVDA 2.85% 01 Apr 2030 | US67066GAF19 | USD 93.39 | 4.89 | 3.29 | -2.72 |
A prominent chipmaker that designs graphics processing units (GPUs) for gaming and artificial intelligence. It held a dominant position in the graphics cards industry with an 80.2% market share in 2Q23. | ||||||
Costco | COST 1.6% | US22160KAP03 | USD 89.7 | 4.72 | 3.43 | -1.78 |
World's 3rd largest retailer which operates a chain of membership-only big-box warehouse club retail stores. | ||||||
Procter & Gamble | PG 4.35% | US742718GF07 | USD 99.79 | 4.44 | 2.25 | -2.30 |
Founded more than 180 years ago with operations in over 70 countries. Specialize in a wide range of personal health/consumer health, personal care, and hygiene products. | ||||||
Nestle | NESNVX 4.65% | USU6408XAK55 | USD 99.95 | 4.67 | 2.30 | -2.33 |
World's largest food and beverage company with over 2,000 brands and a presence in 188 countries. | ||||||
PepsiCo | PEP 4.1% | US713448GL64 | USD 98.96 | 4.57 | 2.21 | -1.87 |
Second-largest food and beverage business in the world based on net revenue, profit, and market capitalization. | ||||||
Coca-Cola Co | KO 2.125% | US191216CM09 | USD 93.1 | 4.61 | 2.83 | -1.66 |
Distributes the world's best-selling soft drink in over 200 countries, outselling its nearest competitor Pepsi by a significant margin. | ||||||
Pfizer | PFE 3.45% | US717081ET61 | USD 97.22 | 4.63 | 2.35 | -1.85 |
Founded in the mid-19th century, American drug maker with a strong and diversified drug portfolio. Biggest pharmaceutical company in the world based on the 2022 revenue. | ||||||
BP Capital America | BPLN 3.723% | US05565QDH83 | USD 97.98 | 4.69 | 2.09 | -1.63 |
Key player in the oil and gas industry that operates in 70 countries. It produces 2.3 million barrels of oil equivalent per day in 2022. | ||||||
McDonald's Corp | MCD 4.8% | US58013MFU36 | USD 100.24 | 4.66 | 1.76 | -1.80 |
The biggest fast-food chain in the world operating in the US and internationally with over 40,000 restaurants worldwide. | ||||||
Walt Disney | DIS 7.625% | USU25497AU95 | USD 106.68 | 4.45 | 2.02 | -2.68 |
Founded in 1923, a leading entertainment and production company known for its iconic animated film theme parks, streaming services, and media networks, creating magical experiences for audiences worldwide. | ||||||
JOHNSON & JOHNSON | JNJ 4.9% | US478160CV47 | USD 100.88 | 4.68 | 4.01 | -3.41 |
Johnson & Johnson manufactures health care products and provides related services for the consumer, pharmaceutical, and medical devices and diagnostics markets. The Company sells products such as skin and hair care products, acetaminophen products, pharmaceuticals, diagnostic equipment, and surgical equipment in countries located around the world. | ||||||
Source: Bloomberg. All prices and yields are indicative and for reference only. Please contact the UOB Kay Hian product team for more information.
Global Financial Institutions
Company | Bond Name | ISIN | Current Price (Sep 3) | YTM (%) | Duration (y) | 6M Performance (%) |
JP Morgan | JPM 4.005% | US46647PAR73 | USD 100.68 | 4.75 | 2.73 | -1.92 |
a) Largest bank in the world by market cap b) CET1 (Common equity Tier 1) ratio at 14.3% in 1Q26. Down 0.2% from 4Q25. Attention: c) Senior Unsecured bond, with respect to the exercise of US bail-in power. d) Resettable features. | ||||||
Bank of America
| BAC 2.087% | US06051GJZ37 | USD 98.14 | 4.75 | 2.39 | -1.36 |
a) The 2nd largest bank, globally, majoring in commercial banking, wealth management and investment banking b) CET1 ratio at 11.2% in 1Q26. Down 0.2% from 4Q25. Attention: c) Senior Unsecured bond, with respect to the exercise of US bail-in power. d) Resettable features. | ||||||
UBS AG | UBS 5.428% | USH42097EV54 | USD 100.87 | 5.04 | 2.24 | -2.33 |
a) One of the most well-established and influential banks globally. Foremost bank in Switzerland, focusing on wealth management, asset management and investment banking. b) CET1 ratio at 14.7% in 1Q26. Up 0.3% from 4Q25. Attention: c) Senior Unsecured bond, with respect to the exercise of Swiss bail-in power. d) Resettable features. | ||||||
HSBC Holdings | HSBC 4.583% | US404280BT50 | USD 101.33 | 4.85 | 3.04 | -1.88 |
a) Bank giant with unique historical and business links to East Asia and a highly multinational footprint b) CET1 ratio at 14.0% in 1Q26. Down 0.9% from 4Q25. Attention: c) Senior Unsecured bond, with respect to the exercise of UK bail-in power. d) Resettable features. | ||||||
BNP Paribas | BNP 5.27% | FR001400JF24 | USD 101.23 | 4.88 | 3.04 | -1.61 |
a) Flagship bank in France, 2nd largest bank in Europe by asset. b) CET1 ratio at 12.8% in 1Q26. Up 0.2% from 4Q25. Attention: c) Senior Preferred bond, with respect to the exercise of France bail-in power. d) Resettable features. | ||||||
Standard Chartered
| STANLN 4.299% 13 Jan 2030 | XS3258535908 | USD 98.23 | 5.10 | 2.19 | -1.76 |
a) Prominent international banking group with a strong presence across Asia, Africa, and the Middle East. b) CET1 ratio at 13.4% in 1Q26. Down 0.7% from 4Q25. Attention: c) Senior Unsecured bond, with respect to the exercise of UK bail-in power. d) Resettable features | ||||||
National Australia Bank | NAB 4.308% 13 Jun 2028 | US632525CJ86 | AUD 98.42 | 5.07 | 3.31 | -0.37 |
a) Australia’s largest business bank (“Big Four”) b) CET1 ratio at 11.48% in 1Q26. Down 0.22% from 4Q25. Attention: c) Senior Unsecured bond | ||||||
FWD Group Holdings
| FWDGHD 7.784% 6 Dec 2033 | XS2730013104 | USD 111.4 | 5.83 | 5.51 | -4.58 |
Hong Kong–headquartered life insurer operating across 10 Asian markets, including Hong Kong, Singapore, Japan, Thailand, Indonesia, and the Philippines, serving over 34 million customers with diversified life, health, and general insurance products. | ||||||
Westpac Banking Corporation
| WSTP 5.151% 12 Feb 2031 | AU3CB0331148 | AUD 100.21 | 5.09 | 3.96 | n.a. |
a) Headquartered in Sydney and Australia’s oldest bank (“Big Four”) b) CET 1 ratio at 12.42% in 1H26. Up 0.18% yoy. Attention: c) Senior Unsecured bond | ||||||
Source: Bloomberg. All prices and yields are indicative and for reference only. Please contact the UOB Kay Hian product team for more information.
We also offer regular updates on selected bonds from the Bond Radar above. The month’s Bond Highlight is on:
BABA 4.875% 26 May 2030
About the Issuer
Alibaba Group Holding Limited (BABA / 9988 HK) is China’s largest e-commerce operator, a major hyperscaler and a full stack AI leader globally. Its businesses span online retail, cloud computing, core AI technologies, logistics and financial services. As of September 3, 2026, BABA has an equity market cap of USD 273bn and cash on hand of USD 57bn. The company has USD 26.88bn of bonds outstanding, with an average maturity of 10 years and an average fixed coupon of 2.92% (Bloomberg).
Investment Thesis
- Full stack AI leadership. Alibaba owns a comprehensive AI ecosystem encompassing cloud services, AI models, application suites, and custom-designed chips. To cement its technological leadership, the company has committed RMB 380 bn (USD 56 bn) in capex over the next three years – one of the highest in China and more than its total capex over the past decade combined. and full stack advantage. Click here for more information on BABA’s full stack advantage.
- Heavy capex as a key credit concern. The heavy capex is a double-edged sword for Alibaba, as in the case for all hyperscalers. Its capex surged 75% yoy to RMB 67.7bn and pushed free cash flow to negative RMB 44.7bn in 1QFY2027, compared with a negative RMB 18.8bn a year earlier.
- Substantial capex unlocks significant monetization potential. On the upside, BABA has already deployed around half of its RMB 380bn three-year AI capex plan. Management estimates AI compute investments have a three-year payback period currently, which could shorten as capacity utilization, proprietary chip adoption and cloud margin continue to improve.
- Key risk remains the return on AI investments (ROI). The main risk is that AI capex remains elevated for longer than expected without sufficient monetization, resulting in prolonged earnings downside and negative free cash flow. UOBKH recently lowered FY2027 earnings estimates by 6.6% due to increasing AI spending. Having said that, Alibaba’s financials remain reasonably healthy for now (see below).
Financial Highlights (1QFY2027)
- Operating cash flow to interest expense: 9.75x. The strong interest coverage indicates comfortable debt-servicing capacity despite elevated capex.
- Free cash flow (FCF) to total debt: -17.33%. The negative FCF reflects BABA’s heavy AI and cloud infrastructure capex as a toll on its cash flow. FCF key is a key credit metric to monitor.
- Net debt / EBITDA: 5.72x. Leverage appears high on this measure, largely reflecting the current investment cycle. Sustained earnings growth and capex monetization are crucial to deleveraging.
- Current ratio: 1.36x. Current assets sit comfortably above short-term liabilities, indicating solid near-term liquidity and adequate working capital buffer.
- Return on invested capital (ROIC): 1.44%. Current low returns reflect the significant upfront investments in AI, which should improve as its AI business continues to scale and deliver higher margins.
Macro Comments
We track the following US economic data to understand the Fed policy and interest rate changes. We then selectively comment on a few of the indicators, those that we deem the most relevant.
Inflation | Consumption | Production | Labor Market | GDP | Fed |
CPI & Core CPI | Consumer Sentiment Index | Manufacturing PMI | Jobless Claim | GDP | FOMC meeting |
PPI & Core PPI | Consumer Credit | Service PMI | Job Openings | GDPNow (est.) | Fed Speeches |
PCE & Core PCE | PCE Consumption | New Orders | Non-farm Payroll |
| FedWatch |
| Retail Sales | Freight Index | Unemployment |
| Prediction Market |
|
|
| Wage Growth |
| FOMC meeting |
Key Conclusion: On the dovish side, US consumption is showing signs of fatigue, and manufacturing data also began to decelerate. On the hawkish side, the latest blowout labor market data was surprisingly robust, reinforcing the Fed’s hawkish stance. The upcoming inflation print (CPI) on Sep 11 should be the data Wall street has been waiting for to finalize the estimation of rate path ahead.
- Labor market data (August Non-farm Payroll). The latest NFP came in at 162K, nearly tripling the consensus forecast of 56K, as unemployment held steady at 4.1%. Market reactions were largely hawkish: FedWatch’s probability for a September rate hike increased from 50% to 60%, while gold declined by 1%, the Dollar Index gained 0.2%, and 10-year Treasury yields rose slightly by 4 bps.
- Inflation (July CPI and PCE). July’s inflation print was mixed, as the headline moderation masked underlying stickiness. Headline CPI cooled to 3.4%, while Core CPI moderated to 2.5% yoy – better than expected and alleviating rate hike fears. On the producer side, PPI cooled meaningfully to 5.5% yoy (from 6.6% in June), with Core PPI edging down to 3.6%. However, Core PCE, Fed’s preferred matric to gauge inflation, held firm at 3.3%, slightly above the expected 3.2%, indicating hurdles of the "last mile" before achieing disinflation.
- Production (August Manufacturing/Service Index). The ISM Manufacturing Index declined 1.0pt to 54.6 in August, missing expectations with weak internals across new orders, production, and employment. Conversely, the ISM Services Index defied broader cooling trends, rising 1.3pt to 55.4 on strong new orders, business activity, and employment components hitting multi-year highs. Generally softening manufacturing data, a 0.5% drop in nominal construction spending, and a downward revision in the S&P Global Services PMI all cast a shadow on broader industrial growth into 2H2026.
- Consumption (July retail and August consumer confidence). US consumers, the primary engine of GDP expansion, begin to show signs of fatigue. Headline and core retail sales contracted by 0.6% and 0.4% mom respectively, marking the first monthly decline this year. This is also a sharp miss against consensus expectations of positive growth MoM. While some weaknesses can be attributed to calendar distortions (i.e. Amazon Prime Day), the structural underpinnings related to fading fiscal tailwinds are concerning. For example, the consumption boost from OBBBA-facilitated tax refunds (which was +17% yoy) has been largely absorbed, leaving limited upside for 2H2026. On sentiment, the UMich Consumer Sentiment Index fell again to 51.7 in August, now barely above the 50 benchmark, confirming that consumer confidence remains fragile amid ongoing inflation and rate concerns.
Fed vs Treasury: Two Drunken Sailors Tied by a Tether
Recent actions and comments by Treasury Secretary Scott Bessent and Fed Chair Kevin Warsh have sparked much controversy, confusion, and even criticism. Simply saying markets will become more volatile would be insufficient. Let’s unpack the likely sources of this volatility to help you better prepare for what lies ahead.
- Two “drunken sailors” on different routes. Needless to say, Treasury and the Fed have fundamentally different mandates, philosophies and policy frameworks. While many view both Bessent and Warsh as Trump’s economic lieutenants, they act relatively independently, with no apparent control over each other. This debunks the myth that Treasury and the Fed will simply do whatever Trump asks them to do.
- Tied by a heavy tether. That “independence” comes with a caveat: while Treasury and the Fed are legally separated, their policies can often collide or collaborate depending on the macro environment and prevailing political pressures. Both Bessent and Warsh know that their playbooks can directly interfere with each other, and they must calibrate their moves carefully to manage any cross-currents. There is indeed a structural tether that can align Treasury and Fed interests and enhance policy transmission, yet also cause conflicts that restrict the effectiveness of unilateral actions.
Category | Treasury | The Fed |
Current Philosophy | Pragmatic intervention, supply-side duration management, and economic nationalism | Reduced forward guidance (Fed signaling), market discipline above intervention, AI as a structural productivity driver (long-term positive) |
Mandates | Economic growth & fiscal solvency: debt management, collecting revenue, financial stability, and promoting US competitiveness | Dual-Mandate: price stability (inflation target) and maximum sustainable employment |
Target Variables | 3-3-3 strategic targets: 3% real GDP growth, budget deficit at 3% of GDP, and oil production rising by 3mn barrels/day. | PCE inflation (~2% target), unemployment under control. |
Primary Tools | Debt issuance management, FX interventions, Treasury General Account (TGA) management, tax code enforcement, emergency credit facilities, sanctions (OFAC), etc. | Federal Funds Rate (policy rate), Quantitative Easing & Tightening (QE/QT), Liquidity Facilities (Discount Window, SRF), Reserve Requirements (IORB/ON RRP rates), etc. |
- More conflict than harmony…for now. Today, Bessent and Warsh not only hold different core philosophies, but also have diverging policies that may work against each other. For example, Bessent recently doubled long-bond buybacks – funded by increased short-term T-bill issuance, while Warsh struck a distinctly hawkish tone at Jackson Hole, implying that he may raise rates soon to combat inflation.
- Still higher certainty at the short-end vs. the long-end. Despite policy frictions between Treasury and the Fed, the short end remains more liquid and predictable at this juncture. Warsh’s plan to shrink the Fed’s USD 7trn balance sheet may entail a structural shift toward short-term bills, helping to digest Bessent’s increased supply at the short end. The long end, however, is far more complex: the Fed unwind, elevated oil prices, rising AI funding demand, US fiscal concerns and bond vigilantes can all push yields higher, making Bessent’s strategy less effective.
- Two drunken sailors tied by a tether. Allow us to bring back our very first point: Treasury and the Fed may be sailing on divergent routes for now, but they are still bound by a “tether” that works both ways. At the end of the day, the ultimate forces aligning their interests include the domestic economy, market stability and policy credibility. Therefore, if all works out, there will be periods of smooth sailing from here when Treasury and the Fed will be in perfect sync. Before then, plenty of volatility ahead.
US yield curve shifts higher across all tenors
Credit View
US Credit: AI Financing Reshapes Investment-Grade Outlook
The US credit market enters September with a broadly constructive backdrop, as corporate earnings and balance sheets remain supportive, and default activities are contained and well below levels typically associated with late-cycle deterioration. Meanwhile, credit spreads remain close to historically tight levels and the higher-for-longer rate environment limits any potential contribution from further spread compression, suggesting that carry and income should remain the primary drivers of returns.
The AI investment cycle remains an important structural change for the credit market. Net US IG issuance is approaching USD 1tn in 2026, as Amazon, Alphabet, Microsoft, Meta, Oracle and SpaceX have collectively issued more than USD 200bn to fund their AI investments. As repeated AI-related issuance increases portfolio concentration and supply pressure, investors are likely to demand greater compensation – particularly from frequent issuers and at longer maturities.
AI financing is also expanding beyond the USD market, as showcased by Alphabet’s inaugural AUD Kangaroo bond. In August, Alphabet raised AUD 5.5bn (around USD 3.9bn) – the largest AUD corporate bond transaction on record. The six-tranche senior unsecured deal included fixed- and floating-rate 3- and 5-year bonds, together with fixed-rate 10- and 20-year maturities. Final pricing was set at BBSW/swap +65bp for the 3-year tranches, +90bp for the 5-year tranches, +133bp for the 10-year bond and +180bp for the 20-year bond, with fixed coupons ranging from 5.20% to 6.90%. Demand was strong, with final orders exceeding AUD 18bn, or roughly 3.3 times the issued amount. The transaction highlights both the depth of demand for scarce, high-rated technology credit in Australia and the ability of hyperscalers to diversify funding across non-USD markets.
We remain overall constructive on US credit but see limited value from a further broad-based spread compression. We continue to favour short-duration (<3 years), higher-quality investment-grade corporate bonds.
Asia Credit: Selectivity Rises as AI Funding Diverges
Asia credit enters September with fundamentals broadly intact, although tight valuations offer less room for disappointment. The JP Morgan Asia Credit Index (JACI) remained at around 88bps into late August, with recent returns driven more by lower Treasury yields than further spread compression. We continue to see carry, rather than aggressive spread tightening, as the main driver of returns.
Chinese technology has become an increasingly important source of dispersion within Asia IG. China’s leading internet firms are expected to commit more than USD 325bn to AI and related capex through 2030, and the sheer scale of investment is increasingly pressuring free cash flow. Alibaba’s HKD 80bn equity placement highlighted the funding need, as its sizeable AI investment programme and declining net-cash position suggest greater reliance on external financing, which could keep its bonds sensitive to future supply. Tencent remains better positioned thanks to its more pragmatic approach to AI investment, stronger recurring cash generation and diversified gaming and advertising revenues, although elevated AI capex has also weakened free cash flow temporarily. Baidu has weaker internal cash generation but greater flexibility to use bank borrowing, leasing and financing through its AI-chip subsidiary. As you can see, China technology is not a broad downgrade story, but rather a sector with divergent credit profiles and duration-based repricing risks.
SK Hynix represents the other side of the AI credit story. While hyperscalers like Alibaba are investing heavily in AI infrastructure, Hynix is directly benefiting from increasing spending on high-bandwidth memory (HBM), advanced DRAM and enterprise SSDs – key components for building AI data centers. Bloomberg Intelligence expects its 2027 operating profit to exceed consensus by around 10-11%, supported by robust HBM demand and higher memory pricing. The earnings strength is translating directly into stronger credit metrics. As a result, S&P upgraded Hynix from BBB+ to A-/Positive in August, following Moody’s earlier upgrade to A3. This is in sharp contrast to increasing credit concerns over the hyperscalers, i.e. capital spenders. The moral of our Hynix story is clear: investors should differentiate between companies paying for AI investments and those earning from them by supplying key components.
We remain overall constructive on Asia credit, but recommend a more selective approach. We favour high-quality Asia IG, shorter to intermediate-duration carry, defensive financials and issuers directly benefiting from AI investment growth such as SK Hynix. Meanwhile, we are more cautious on long-dated Chinese hyperscaler bonds where AI capex is weakening free cash flow for now, richly valued senior financials, and issuers with persistent external funding requirements.
Asia Pacific Key Sovereign Rates Monitor
Region | 2 Year | 5 Year | 10 Year | 30 Year |
Australia | 4.77 | 4.79 | 5.17 | 5.64 |
China | 1.21 | 1.39 | 1.68 | 2.16 |
China (usd) | NA | NA | NA | NA |
India | 6.24 | 6.45 | 6.96 | 7.54 |
Indonesia | 6.62 | 6.90 | 7.10 | 7.18 |
Indonesia (USD) | 4.23 | 5.10 | 5.71 | 6.03 |
Japan | 1.83 | 2.26 | 2.94 | 4.05 |
Malaysia | NA | 3.53 | 3.91 | 4.28 |
New Zealand | 3.58 | 4.18 | 4.76 | 5.42 |
Pakistan | NA | 11.76 | 12.12 | NA |
Philippines | 6.06 | 7.02 | NA | NA |
Philippines (USD) | 4.37 | 4.90 | 5.61 | NA |
Singapore | 1.68 | 2.01 | 2.36 | 2.44 |
South Korea | 3.66 | 4.10 | 4.35 | NA |
South Korea (USD) | 4.22 | 4.37 | NA | NA |
Taiwan | 1.67 | 1.82 | 1.85 | 2.09 |
Thailand | 1.15 | 1.60 | 2.19 | 3.18 |
Source: Bloomberg, as of Sep 3, 2026
Credit Spreads
Credit Yields
Bond ETF and Fund Radar
Key Risks for Investing in Bond Funds
- Market risk: Bond prices can fall due to rising interest rates, widening credit spreads, economic slowdowns, or issuer-specific issues.
- Currency risk: FX movements can significantly affect returns.
o Stronger USD boosts unhedged foreign holdings in SGD terms.
o Weaker USD can offset or even reverse bond gains.
- Hedged share classes: Many funds offer SGD, EUR, AUD, HKD, or CNH-hedged classes to reduce FX volatility and focus on credit and duration exposure.
High-Yield Exposure
- Global bond funds may hold both investment-grade and high-yield bonds.
- High-yield bonds carry higher default, macro, and liquidity risks.
- This means greater price volatility and potential capital losses, especially if the exposure is unhedged in a weakening currency.
Key Considerations
- Past performance is not indicative of future results.
- Yield alone should not drive investment decisions.
- If diversifying away from USD amid de-dollarisation trends, compare:
o Hedged share classes
o Hedging costs
o Overall risk–return profile
Bond ETF and Fund Radar: Key Facts
Name | Category | Duration Type | Expense | Effective Duration | Average Yield | Credit Quality |
Vanguard Short-Term Corporate Bond ETF (VCSH US) | Investment Grade ETF | Short | 0.03% | 2.7 | 5.00% | 54.79% in A rated and above 45.23% in BBB rated Average Quality – A- |
iShares Core U.S. Aggregate Bond ETF (AGG US) | Investment Grade ETF | Intermediate | 0.03% | 5.78 | 5.06% | 87.89% in A rated and above 11.56% in BBB rated Average Quality – AA |
iShares iBoxx $ Investment Grade Corporate Bond ETF (LQD US) | Investment Grade ETF | Long | 0.14% | 7.71 | 5.72% | 59.36% in A rated and above 39.87% in BBB rated Average Quality – A- |
HSBC Short Duration Bond Fund | Investment Grade UT | Short | 0.70% | 2.57 | 4.90% | 43.49% in A rated and above 44.75% in BBB rated 10.32% in HY Average Quality – A-/BBB+ |
PIMCO GIS Income Fund | Investment Grade UT | Intermediate | 1.45% | 6.73 | 7.32% | 80.60% in A rated and above 9.90% in BBB 9.20% in HY Average Quality – AA- |
Fidelity US Dollar Bond Fund | Investment Grade UT | Long | 1.03% | 6.6 | 5.03% | 81.18% in A rated and above 12.84% in BBB 2.33% in HY Average Quality – AA- |
Source: Bloomberg, MorningStar, iShares and Vanguard as of Sep 3, 2026. US listed ETFs might subject investors to a 30% withholding tax on all dividends received. Please consult your tax consultant for further information.
Bond ETF and Fund Radar (continued): Performance Data
Fund Name | ISIN / Ticker | Currency | 1 Month Total Return (%) | YTD Total | 1 Year Total Return (%) |
HSBC GIF Global Short Duration Bond Fund | LU1163226092 | USD | 0.03 | 1.48 | 3.06 |
LU1272399756 | SGD | -0.20 | -0.27 | 0.28 | |
LU2639850283 | EUR | -0.09 | 0.29 | 1.10 | |
PIMCO GIS Income Fund | IE00B7KFL990 | USD | -0.22 | -0.17 | 2.78 |
IE00B9HH6X13 | SGD | -0.38 | -1.87 | 0.04 | |
IE00B84J9L26 | EUR | -0.35 | -1.32 | 0.85 | |
Fidelity Funds - US Dollar Bond Fund | LU0261947682 | USD | -0.22 | -1.75 | -0.33 |
LU2605879787 | SGD | -0.47 | -3.46 | -3.11 | |
LU2730164063 | EUR | -0.34 | -2.93 | -2.29 | |
Vanguard Short-Term Corporate Bond ETF (VCSH US) | VCSH US | USD | 0.02 | 0.94 | 2.58 |
iShares Core U.S. Aggregate Bond ETF (AGG US) | AGG US | USD | -0.09 | -0.41 | 1.56 |
iShares iBoxx $ Investment Grade Corporate Bond ETF (LQD US) | LQD US | USD | -0.30 | -1.39 | 0.55 |
Bloomberg US Aggregate Total Return Index | LBUSTRUU Index | USD | -0.04 | -0.49 | 1.60 |
Source: Bloomberg as of Sep 3, 2026. Based on the accumulative share class for unit trust (no fund dividends) and dividend reinvestment for ETF.
Glossary
Average Coupon: the weighted average of the various coupons of a bond portfolio.
Average Credit Quality: the weighted average of each bond’s credit rating in a portfolio. See Average Rating below.
Average Duration: the sensitivity of the value of a bond portfolio to interest rate changes. The longer the duration, the more sensitive toward interest rate changes.
Average Rating: the weighted average rating of all bonds in a portfolio. For example, a portfolio with 25% in AAA, 25% in BBB and 50% CCC bonds would have a weighted average credit rating of B+, which is between BBB and CCC.
Average Yield To Maturity: the rate of return required for the present value of all the future cash flows of a bond portfolio to equal the current bond price.
Yield To Worst (YTW): a measure of the lowest possible yield on a bond that fully operates within the terms of its contract without defaulting. It is based on the earliest call or retirement date, assuming that a prepayment of principal occurs if a bond issuer uses the call option.
Effective Duration: see Average Duration above.
Effective Maturity: the date used in place of the final maturity for bonds with call, put or prepayment features.
Running Yield: coupon divided by a bond portfolio’s market price. This is different from Yield to Maturity as the Running Yield does not take into account if the bond market price is below or above Maturity redemption value.
Analyst
Qi Wang, CFA
qi.wang@uobkh.comAnalyst
Wendy Chen
wendy.chen@uobkh.comAnalyst
Benjamin Tan
benjamintan@uobkh.comDisclosures and disclaimers
This report is provided subject to, and must be read together with, the full Disclosures / Disclaimers available at this link, which are incorporated by reference into this report. In particular, this report is intended for general circulation and informational purposes only and does not constitute personal investment advice or a recommendation to buy or sell any investment product or security. You should independently evaluate the information and, where necessary, seek advice from a qualified financial adviser regarding the suitability of any investment. Analyst certifications required under applicable regulations, including SEC Regulation AC (where relevant), are included in this report. By accessing, receiving or using this report, you acknowledge that you have read, understood and agreed to be bound by the Disclosures / Disclaimers, as may be amended, supplemented or updated from time to time.


