

Our previous report made the case for a multi-year Memory Supercycle, underpinned by an AI-driven demand/supply imbalance. We now turn to stock selection. Not all memory makers are equally positioned, with each having its own fundamental strengths and weaknesses. Read on to learn why SK Hynix and Micron are our top picks for now, while Samsung and CXMT remain on our watch list.
CIO Summary
- SK Hynix (000660.KS / SKHY) is our top pick in the memory sector, combining HBM technology leadership and the purest exposure to AI memory demand. Key risk: intensifying competition, particularly from Samsung Electronics.
- Micron (MU) is our other pick, combining similar exposure to the Memory Supercycle alongside its unique advantage as the only major US DRAM maker. Key risk: execution challenges in HBM and its massive US manufacturing expansion.
- Despite robust industry fundamentals, both Hynix and Micron are rated Investment Opportunities (previously known as Trading Buys), rather than Core Recommendations, reflecting our medium-conviction given their respective company-specific risks.
- Neither Samsung Electronics (005930.KS) nor CXMT (688825.CH) is recommended at this point. The former is a DRAM capacity leader, but its conglomerate structure could dilute its memory exposure from time to time. The latter remains constrained by smaller scale, lagging technology and negligible HBM mix, while trading at a significantly higher valuation.
Before diving into individual companies, we'd like to present a few tables comparing major memory players across product mix, profitability and growth, providing important context for stock selection. Please note that Micron figures are adjusted to the closest calendar year to facilitate comparison.
Table 1: Revenue Contribution by Product (2026E)
| DRAM (ex. HBM) | HBM | NAND | Other | Total |
Samsung | 41% | 4% | 26% | 29% | 100% |
SK Hynix | 60% | 14% | 26% | 0% | 100% |
Micron | 68% | 7% | 25% | 0% | 100% |
CXMT | 100% | 0% | 0% | 0% | 100% |
Table 2: Operating Profit Contribution by Product (2026E)
| DRAM (ex. HBM) | HBM | NAND | Other | Total |
Samsung | 62% | 5% | 33% | 0.3% | 100% |
SK Hynix | 65% | 13% | 22% | 0% | 100% |
Micron | 70% | 6% | 23% | 1% | 100% |
CXMT | 100% | 0% | 0% | 0% | 100% |
Table 3: Operating Margin Trend and Comparison (2025-2029E)
| Op Margin 2025 | Op Margin 2026E | Op Margin 2027E | Op Margin 2028E | Op Margin 2029E |
Samsung | 13% | 53% | 59% | 57% | 42% |
SK Hynix | 49% | 78% | 82% | 80% | 67% |
Micron | 33% | 79% | 86% | 86% | 78% |
CXMT | 14% | 70% | 72% | 72% | N/A |
Table 4: Operating Profit Growth by Product (3-Year CAGR from 2026E to 2029E)
| DRAM (ex. HBM) | HBM | NAND | Other | Total Growth |
Samsung | 3% | 69% | 0% | 216% | 10% |
SK Hynix | 7% | 64% | -14% | N/A | 15% |
Micron | 12% | 93% | 5% | N/A | 19% |
CXMT | 46% | N/A | N/A | N/A | 46% |
Table 5: Operating Profit Growth Contribution by Product (3-Year CAGR from 2026E to 2029E)
| DRAM (ex. HBM) | HBM | NAND | Other | Total |
Samsung | 18% | 58% | -1% | 25% | 100% |
SK Hynix | 28% | 88% | -16% | 0% | 100% |
Micron | 43% | 52% | 6% | 0% | 100% |
CXMT | 100% | 0% | 0% | 0% | 100% |
Source: Companies and UOB Kay Hian, Morgan Stanley, UBS estimates.
Key Takeaways
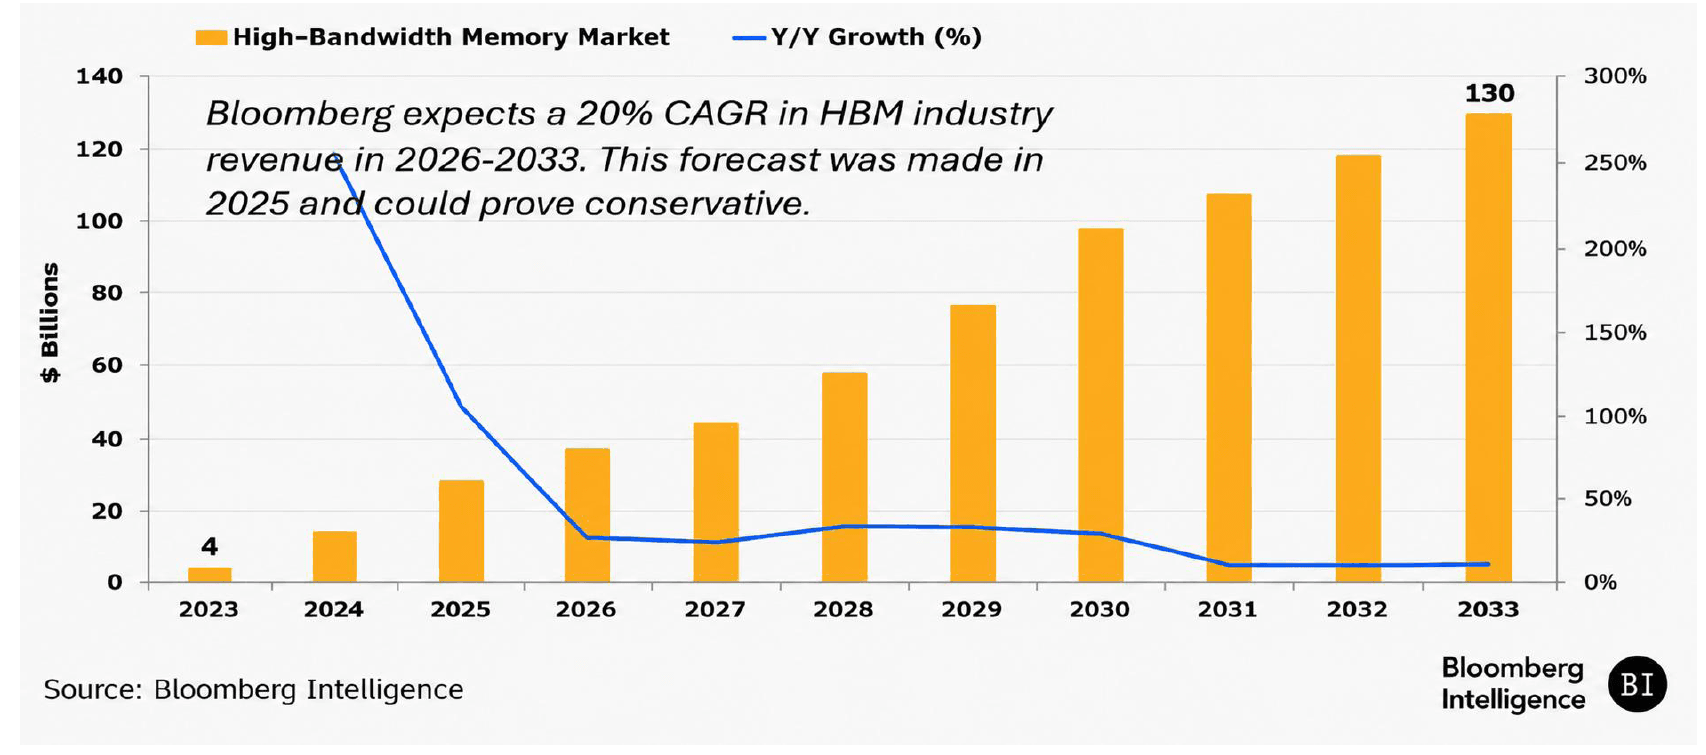
- HBM: at the heart of the AI-driven Memory Supercycle. High Bandwidth Memory (HBM) is a next-generation memory technology designed specifically for AI workloads. As AI models grow larger and more complex, the key bottleneck is no longer computing power alone (e.g. Nvidia, Broadcom), but the capacity and speed of the memory attached to the processor. Consensus forecasts suggest HBM bit demand growth of roughly 50% CAGR (2026-2029), significantly outpacing overall DRAM bit growth of 14-22% while exhibiting structurally lower cyclicality.
- Capacity-hungry HBM reinforces overall memory shortage and profit surge. HBM requires multiple DRAM dies (typically 8-16) to be stacked vertically. This is not only a major technological challenge, but also consumes enormous manufacturing capacity – with HBM requiring roughly 3-4x the wafer capacity of conventional DRAM. Indeed, vendors are shifting more capacity to HBM (see rationale below), causing severe shortages in conventional memory and driving prices higher. Though conventional memory remains the profit center, HBM is the ultimate earnings driver – both directly and indirectly through its outsized capacity consumption (Table 2, 4 & 5).
- A formidable HBM moat means only three players. HBM is not just “advanced DRAM". It combines leading-edge IC design, advanced packaging, thermal management and customer qualification into one of the most demanding products in semiconductors. These technological hurdles form a highly defensible moat, effectively limiting HBM competition to just three players: Samsung, Hynix and Micron. Although China’s CXMT is emerging as a potential contender, it is far from producing competitive HBM at scale, due to its lagging technology and US export restrictions.
- HBM: a rare source of high-certainty growth. HBM profitability is currently constrained by lower yields, largely due to the complexity of multi-die stacking and 3D packaging. This means HBM margins could be below the DRAM average today. Yet all three leading memory makers still favor HBM for its higher growth (see above), higher revenue visibility and potential for margin expansion (see below). Much of HBM capacity is committed well in advance (up to 5 years ahead) through long-term supply agreements (LTAs) with key customers, with a more predictable pricing framework. Such high demand visibility has historically been rare in the DRAM industry, prompting suppliers to embrace HBM as a source of high-certainty growth.
- Margin expansion unlocks further earnings upside. HBM’s below-average margins help explain why its profit contribution is in line with, or below, its share of revenue (Table 1 & 2). However, HBM margins have room to expand. As the technology matures, yields should continue to improve, driving sustainable margin expansion over time, not only in HBM but also at the group level (Table 3).
SK Hynix (000660.KS / SKHY) – Investment Opportunity
Investment Thesis
- Clear HBM leader with durable competitive advantages. Hynix is the industry's leading HBM supplier (around 50% market share), benefiting from its superior technology (e.g. leading in HBM4), deep customer relationships (e.g. co-design deal with Nvidia) and a proven ability to commercialize complex HBM ahead of competitors (80% yield and 78% operating margin for HBM – both highest in the industry). Wall Street expects Hynix to maintain its leadership even as competition intensifies.
- Purest exposure to the AI-driven Memory Supercycle. Hynix also has the highest HBM exposure, giving it the most direct leverage to surging AI memory demand. HBM accounts for 14% of its revenue, 13% of operating profit yet 88% of future profit growth – all highest in the industry (see tables above).
- Compelling valuation despite strong performance YTD. 000660.KS is currently trading at 3.7x 2027E PE, near the low end of its 3.3x-2294x historical range. Thanks to strong earnings growth (+471% in 2026E and +34% in 2027E), Hynix’s valuation remains undemanding despite delivering +159% return YTD (as of Oct 8). Furthermore, we believe there is scope for multiple expansion driven by margin improvement (see above) and reduced cyclicality from HBM’s secular growth.
Key Risks
- Memory industry risks have been highlighted in our previous report and reiterated here, including technological shifts, a potential slowdown in AI capex and conventional memory cyclicality.
- Loss of HBM leadership amid intensifying competition. Faster-than-expected progress by Samsung or other competitors could pressure Hynix’s HBM market share, pricing and profitability. Goldman Sachs specifically highlights Samsung's HBM progress as a key risk, while UBS forecasts Hynix's HBM market share to decline from 48% in 2026 to below Samsung’s in 2027. However, Hynix is still expected to deliver substantially higher yields and margins than its peers (see Table 4).
- Korean retail leverage risk. The extreme volatility in June-July was a stark reminder of leverage in Korean equities. While institutional and ETF deleveraging was largely completed by August, retail investors have since re-leveraged, driving margin financing balances back to KRW 33tn (Appendix A). Elevated retail leverage could amplify downside in the event of weaker memory prices or a broader market pullback, potentially leading to forced liquidations similar to those seen in mid-2026.
- ADR premium risk. Since its Nasdaq listing in early July, SK Hynix’s ADR (SKHY) has been trading at a substantial premium to its Korean-listed shares (range: 30%-60%. Oct 8: 40%). Several factors contribute to the premium, including easier US market access and caps on local-shares-to-ADR conversion. However, we have not found a reliable framework for modelling this premium. A narrowing of the premium could therefore hurt ADR returns independently of Hynix’s underlying fundamentals.
Valuation & Price Target
- Hynix (000660.KS / SKHY) is currently trading at 3.7x / 5.0x forward PE, respectively, with earnings expected to grow 471% in 2026E and 34% in 2027E (see valuation comp on page 6).
- Average Wall Street price targets stand at KRW 3269411 / USD 256.2 per share, implying 94.5% / 48.2% upside, respectively, from the Oct 8 closing prices.
Micron (MU) – Investment Opportunity
Investment Thesis
- Leveraged to the same AI-driven Memory Supercycle. Micron is the world’s third largest HBM supplier globally (est. 23% market share, behind Hynix and Samsung), while seeking to narrow its technology and market-share gaps. Naturally, Micron also benefits directly from surging demand for HBM, driven by the ongoing AI investment cycle. As discussed above, this should translate into higher revenue growth, greater earnings visibility and potential margin expansion for all three firms (see tables above).
- Unique beneficiary of US semiconductor reshoring. As the only major US DRAM producer, Micron is uniquely positioned to benefit from CHIPS Act support, domestic manufacturing expansion and Trump’s reshoring policies (see Appendix B for details). Fundamental benefits aside, its geopolitical positioning could provide an additional tailwind to investor sentiment and valuation.
- Compelling valuation similar to Hynix. Micron is currently trading at 6x 2027E PE, near the low end of its 4.1x-4500x historical range. Its PE valuation remains undemanding given the scope for sustained earnings growth, margin expansion and a persistent geopolitical premium.
Key Risks
- Memory industry risks have been highlighted in our previous report and reiterated here, including technological shifts, a potential slowdown in AI capex and conventional memory cyclicality.
- HBM technology and execution risk. Micron is ramping HBM4 rapidly (about 2x faster than HBM3). However, catching up with Hynix and Samsung requires continued upgrades to increasingly advanced HBM generations, making successful execution critical to its investment thesis.
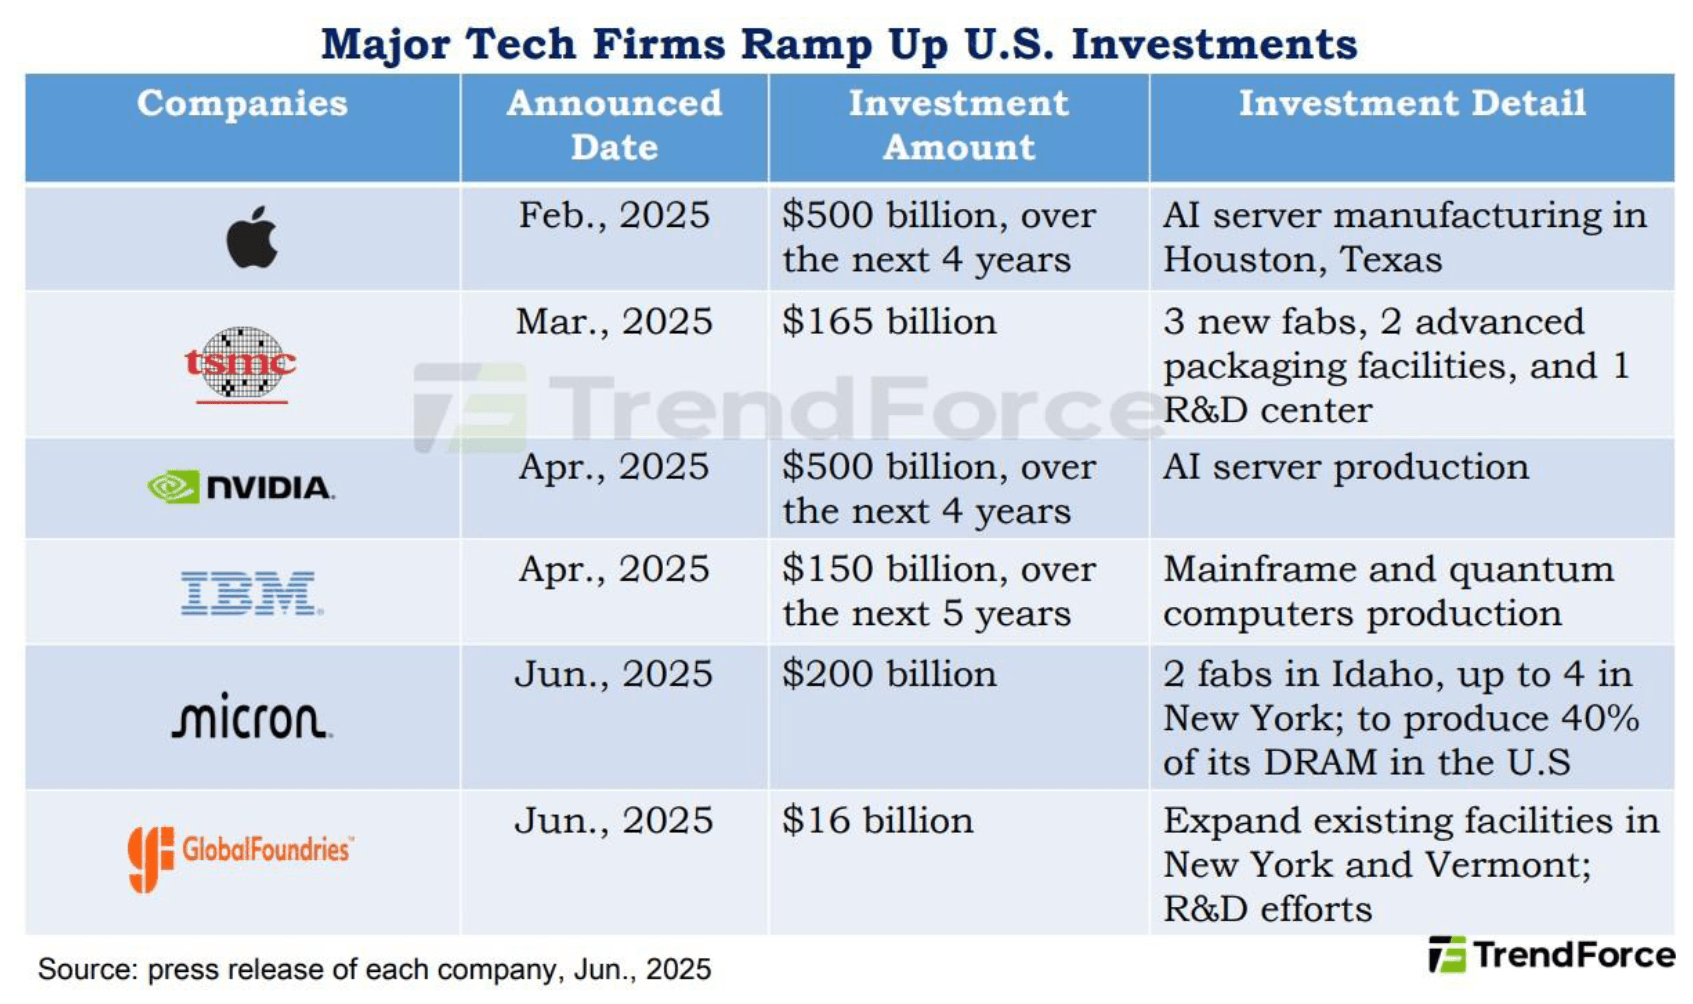
- US expansion risk. Micron is undertaking a massive manufacturing expansion in the US, with over USD 200bn of planned investment in Idaho and New York. Cost overruns, construction delays or slower-than-expected production ramps could affect returns on that investment (see Appendix B).
Valuation & Price Target
- Micron (MU) is currently trading at 6x forward PE, with earnings up 811% in 2026 (Sep 2026) and expected to grow 126% in 2027E (see valuation comp on page 6).
- Average Wall Street price target is USD 1621.44 per share, implying 56.5% upside from the Oct 8 closing price.
Other Companies (Not Recommended)
- Samsung Electronics (005930.KS): Capacity leader, but not a pure play on memory. Samsung leads in overall DRAM manufacturing capacity (40% of global capacity) and is a solid No. 2 in HBM market share (around 33%). Though memory accounts for over 99% of its operating profit today, Samsung’s DRAM business competes internally with other divisions for capital and resources – from foundry and logic chips to smartphones, displays and consumer electronics. While being a conglomerate offers diversification benefits, it can dilute management focus and make Samsung a less pure play on the Memory Supercycle. We prefer Hynix (HBM technology leadership) and Micron (geopolitical advantage) over Samsung at this juncture. Having said that, we’ll be watching Samsung’s capacity ramp closely, especially in HBM, as both a potential stock catalyst and a competitive threat to Hynix.
- CXMT (688825.CH): ambitious but not yet competitive. Chinese player CXMT is up-and-coming, already the largest DRAM maker in China and No. 4 globally. The firm has a smaller scale (just 9% of global bit supply in 2026), lagging technology and negligible HBM exposure (Table 1) – all reflected in its below-average margins (Table 2). It is also pushing into HBM, but the economics remain challenging due to low yields (reportedly 20-30% vs. 80% at Hynix). Nevertheless, developing a domestic HBM capability is strategically important for China, meaning CXMT will forge ahead despite poor economics. The technological hurdles remain formidable, spanning the EUV wall, die stacking, packaging and TSV bottlenecks – none of which can be easily resolved. Not to mention that ongoing US export restrictions on China form another major constraint. Therefore, we see CXMT as neither a meaningful threat to the industry leaders nor an attractive investment candidate at this stage. At 11.6x forward PE, the stock also trades at a significant premium to its global peers.
Valuation Comp

Source: UOB Kay Hian, Bloomberg, as of 8 October 2026. Note: Micron Fiscal Year ends in August / September.
Credit Metrics
Company | Period | Operating Cash Flow to Interest | Free Cash Flow to Debt | Net debt / EBITDA | Current Ratio |
Samsung | 2Q2026 | 533.40 | 4.06 | -0.73 | 2.83 |
Hynix | 2Q2026 | 423.84 | 2.59 | -0.47 | 2.59 |
Micron | 2Q2026 | 371.97 | 0.51 | -0.16 | 2.90 |
CXMT | 1H2026 | 90.58 | 0.76 | -0.24 | 3.22 |
Source: Companies.
Appendix A: Korean Market De-leveraging Update
Leverage in the Korean stock market has played an important role in memory stock trading, that two of the world’s top three memory makers are primarily listed in Korea. Here is a quick update, supported by data below.
- Institutional deleveraging is largely complete. Sharp declines in hedge fund exposure and leveraged ETF AUM suggest the bulk of the deleveraging has already taken place.
- Retail investors, however, have re-leveraged. Margin financing balances have rebounded despite higher borrowing costs following BOK rate hikes, likely encouraged by the KOSPI’s 32% rebound from its July lows.
| June Peak | July trough | Current level |
KOSPI | ~9,100 | ~5,500 | ~6,600 |
KOSPI Forward PE | ~8x | ~5x | ~5.5x |
KOSPI Volatility | 96 | 55 (August) | 37 |
Bank of Korea Policy Rate | 2.75% | 3.00% | Expecting another 25bps hike in 2026 |
USD/KRW | ~1550 | ~1420 | ~1340 |
Hedge Fund Long/Short Ratio | 5.7x | 3.2x | 3-4x |
Leveraged ETF AUM | ~USD 50bn | ~USD 17bn | ~USD 25bn |
Margin Balance | ~KRW 39trn | ~KRW 27trn | ~KRW 33trn |
Source: JP Morgan, Bloomberg
Appendix B: Data Points on Micron’s US Reshoring Advantage
- Up to USD 6.165bn in CHIPS Act direct funding was awarded for Micron’s leading-edge DRAM projects in Idaho and New York. The funding supports Micron’s commitment to spend approximately USD 50bn by 2030. [ptacts.uspto.gov], [micron.com]
- Micron’s longer-term plans originally contemplated approximately USD 100bn in New York and USD 25bn in Idaho. [ptacts.uspto.gov]
- In June 2025, Micron and the Trump administration announced an expanded plan totaling approximately USD 200bn, comprising USD 150bn in U.S. memory manufacturing and USD 50bn in R&D. The plan was expected to create approximately 90,000 direct and indirect jobs. [investors.micron.com]
- The 2025 expansion added USD 30bn beyond prior plans, including a second leading-edge fab in Idaho, modernization and expansion in Virginia, and advanced U.S. packaging capacity for HBM. [investors.micron.com]
- Micron said these investments support an objective of producing 40% of its DRAM in the United States. [investors.micron.com], [micron.com]
- Micron’s first Idaho fab is scheduled to begin DRAM output in 2027. Its two planned Idaho fabs are expected to create more than 17,000 jobs. [investors.micron.com], [micron.com]
- Micron’s Virginia expansion involves more than USD 2bn of investment and supports more than 3,100 direct manufacturing and community jobs. [micron.com]
- Micron now describes its planned U.S. investment as more than USD 250bn through 2035, although that latest figure extends beyond the original CHIPS-backed commitments.
Our previous report made the case for a multi-year Memory Supercycle, underpinned by an AI-driven demand/supply imbalance. We now turn to stock selection. Not all memory makers are equally positioned, with each having its own fundamental strengths and weaknesses. Read on to learn why SK Hynix and Micron are our top picks for now, while Samsung and CXMT remain on our watch list.
CIO Summary
- SK Hynix (000660.KS / SKHY) is our top pick in the memory sector, combining HBM technology leadership and the purest exposure to AI memory demand. Key risk: intensifying competition, particularly from Samsung Electronics.
- Micron (MU) is our other pick, combining similar exposure to the Memory Supercycle alongside its unique advantage as the only major US DRAM maker. Key risk: execution challenges in HBM and its massive US manufacturing expansion.
- Despite robust industry fundamentals, both Hynix and Micron are rated Investment Opportunities (previously known as Trading Buys), rather than Core Recommendations, reflecting our medium-conviction given their respective company-specific risks.
- Neither Samsung Electronics (005930.KS) nor CXMT (688825.CH) is recommended at this point. The former is a DRAM capacity leader, but its conglomerate structure could dilute its memory exposure from time to time. The latter remains constrained by smaller scale, lagging technology and negligible HBM mix, while trading at a significantly higher valuation.
Before diving into individual companies, we'd like to present a few tables comparing major memory players across product mix, profitability and growth, providing important context for stock selection. Please note that Micron figures are adjusted to the closest calendar year to facilitate comparison.
Table 1: Revenue Contribution by Product (2026E)
| DRAM (ex. HBM) | HBM | NAND | Other | Total |
Samsung | 41% | 4% | 26% | 29% | 100% |
SK Hynix | 60% | 14% | 26% | 0% | 100% |
Micron | 68% | 7% | 25% | 0% | 100% |
CXMT | 100% | 0% | 0% | 0% | 100% |
Table 2: Operating Profit Contribution by Product (2026E)
| DRAM (ex. HBM) | HBM | NAND | Other | Total |
Samsung | 62% | 5% | 33% | 0.3% | 100% |
SK Hynix | 65% | 13% | 22% | 0% | 100% |
Micron | 70% | 6% | 23% | 1% | 100% |
CXMT | 100% | 0% | 0% | 0% | 100% |
Table 3: Operating Margin Trend and Comparison (2025-2029E)
| Op Margin 2025 | Op Margin 2026E | Op Margin 2027E | Op Margin 2028E | Op Margin 2029E |
Samsung | 13% | 53% | 59% | 57% | 42% |
SK Hynix | 49% | 78% | 82% | 80% | 67% |
Micron | 33% | 79% | 86% | 86% | 78% |
CXMT | 14% | 70% | 72% | 72% | N/A |
Table 4: Operating Profit Growth by Product (3-Year CAGR from 2026E to 2029E)
| DRAM (ex. HBM) | HBM | NAND | Other | Total Growth |
Samsung | 3% | 69% | 0% | 216% | 10% |
SK Hynix | 7% | 64% | -14% | N/A | 15% |
Micron | 12% | 93% | 5% | N/A | 19% |
CXMT | 46% | N/A | N/A | N/A | 46% |
Table 5: Operating Profit Growth Contribution by Product (3-Year CAGR from 2026E to 2029E)
| DRAM (ex. HBM) | HBM | NAND | Other | Total |
Samsung | 18% | 58% | -1% | 25% | 100% |
SK Hynix | 28% | 88% | -16% | 0% | 100% |
Micron | 43% | 52% | 6% | 0% | 100% |
CXMT | 100% | 0% | 0% | 0% | 100% |
Source: Companies and UOB Kay Hian, Morgan Stanley, UBS estimates.
Key Takeaways
- HBM: at the heart of the AI-driven Memory Supercycle. High Bandwidth Memory (HBM) is a next-generation memory technology designed specifically for AI workloads. As AI models grow larger and more complex, the key bottleneck is no longer computing power alone (e.g. Nvidia, Broadcom), but the capacity and speed of the memory attached to the processor. Consensus forecasts suggest HBM bit demand growth of roughly 50% CAGR (2026-2029), significantly outpacing overall DRAM bit growth of 14-22% while exhibiting structurally lower cyclicality.
- Capacity-hungry HBM reinforces overall memory shortage and profit surge. HBM requires multiple DRAM dies (typically 8-16) to be stacked vertically. This is not only a major technological challenge, but also consumes enormous manufacturing capacity – with HBM requiring roughly 3-4x the wafer capacity of conventional DRAM. Indeed, vendors are shifting more capacity to HBM (see rationale below), causing severe shortages in conventional memory and driving prices higher. Though conventional memory remains the profit center, HBM is the ultimate earnings driver – both directly and indirectly through its outsized capacity consumption (Table 2, 4 & 5).
- A formidable HBM moat means only three players. HBM is not just “advanced DRAM". It combines leading-edge IC design, advanced packaging, thermal management and customer qualification into one of the most demanding products in semiconductors. These technological hurdles form a highly defensible moat, effectively limiting HBM competition to just three players: Samsung, Hynix and Micron. Although China’s CXMT is emerging as a potential contender, it is far from producing competitive HBM at scale, due to its lagging technology and US export restrictions.
- HBM: a rare source of high-certainty growth. HBM profitability is currently constrained by lower yields, largely due to the complexity of multi-die stacking and 3D packaging. This means HBM margins could be below the DRAM average today. Yet all three leading memory makers still favor HBM for its higher growth (see above), higher revenue visibility and potential for margin expansion (see below). Much of HBM capacity is committed well in advance (up to 5 years ahead) through long-term supply agreements (LTAs) with key customers, with a more predictable pricing framework. Such high demand visibility has historically been rare in the DRAM industry, prompting suppliers to embrace HBM as a source of high-certainty growth.
- Margin expansion unlocks further earnings upside. HBM’s below-average margins help explain why its profit contribution is in line with, or below, its share of revenue (Table 1 & 2). However, HBM margins have room to expand. As the technology matures, yields should continue to improve, driving sustainable margin expansion over time, not only in HBM but also at the group level (Table 3).
SK Hynix (000660.KS / SKHY) – Investment Opportunity
Investment Thesis
- Clear HBM leader with durable competitive advantages. Hynix is the industry's leading HBM supplier (around 50% market share), benefiting from its superior technology (e.g. leading in HBM4), deep customer relationships (e.g. co-design deal with Nvidia) and a proven ability to commercialize complex HBM ahead of competitors (80% yield and 78% operating margin for HBM – both highest in the industry). Wall Street expects Hynix to maintain its leadership even as competition intensifies.
- Purest exposure to the AI-driven Memory Supercycle. Hynix also has the highest HBM exposure, giving it the most direct leverage to surging AI memory demand. HBM accounts for 14% of its revenue, 13% of operating profit yet 88% of future profit growth – all highest in the industry (see tables above).
- Compelling valuation despite strong performance YTD. 000660.KS is currently trading at 3.7x 2027E PE, near the low end of its 3.3x-2294x historical range. Thanks to strong earnings growth (+471% in 2026E and +34% in 2027E), Hynix’s valuation remains undemanding despite delivering +159% return YTD (as of Oct 8). Furthermore, we believe there is scope for multiple expansion driven by margin improvement (see above) and reduced cyclicality from HBM’s secular growth.
Key Risks
- Memory industry risks have been highlighted in our previous report and reiterated here, including technological shifts, a potential slowdown in AI capex and conventional memory cyclicality.
- Loss of HBM leadership amid intensifying competition. Faster-than-expected progress by Samsung or other competitors could pressure Hynix’s HBM market share, pricing and profitability. Goldman Sachs specifically highlights Samsung's HBM progress as a key risk, while UBS forecasts Hynix's HBM market share to decline from 48% in 2026 to below Samsung’s in 2027. However, Hynix is still expected to deliver substantially higher yields and margins than its peers (see Table 4).
- Korean retail leverage risk. The extreme volatility in June-July was a stark reminder of leverage in Korean equities. While institutional and ETF deleveraging was largely completed by August, retail investors have since re-leveraged, driving margin financing balances back to KRW 33tn (Appendix A). Elevated retail leverage could amplify downside in the event of weaker memory prices or a broader market pullback, potentially leading to forced liquidations similar to those seen in mid-2026.
- ADR premium risk. Since its Nasdaq listing in early July, SK Hynix’s ADR (SKHY) has been trading at a substantial premium to its Korean-listed shares (range: 30%-60%. Oct 8: 40%). Several factors contribute to the premium, including easier US market access and caps on local-shares-to-ADR conversion. However, we have not found a reliable framework for modelling this premium. A narrowing of the premium could therefore hurt ADR returns independently of Hynix’s underlying fundamentals.
Valuation & Price Target
- Hynix (000660.KS / SKHY) is currently trading at 3.7x / 5.0x forward PE, respectively, with earnings expected to grow 471% in 2026E and 34% in 2027E (see valuation comp on page 6).
- Average Wall Street price targets stand at KRW 3269411 / USD 256.2 per share, implying 94.5% / 48.2% upside, respectively, from the Oct 8 closing prices.
Micron (MU) – Investment Opportunity
Investment Thesis
- Leveraged to the same AI-driven Memory Supercycle. Micron is the world’s third largest HBM supplier globally (est. 23% market share, behind Hynix and Samsung), while seeking to narrow its technology and market-share gaps. Naturally, Micron also benefits directly from surging demand for HBM, driven by the ongoing AI investment cycle. As discussed above, this should translate into higher revenue growth, greater earnings visibility and potential margin expansion for all three firms (see tables above).
- Unique beneficiary of US semiconductor reshoring. As the only major US DRAM producer, Micron is uniquely positioned to benefit from CHIPS Act support, domestic manufacturing expansion and Trump’s reshoring policies (see Appendix B for details). Fundamental benefits aside, its geopolitical positioning could provide an additional tailwind to investor sentiment and valuation.
- Compelling valuation similar to Hynix. Micron is currently trading at 6x 2027E PE, near the low end of its 4.1x-4500x historical range. Its PE valuation remains undemanding given the scope for sustained earnings growth, margin expansion and a persistent geopolitical premium.
Key Risks
- Memory industry risks have been highlighted in our previous report and reiterated here, including technological shifts, a potential slowdown in AI capex and conventional memory cyclicality.
- HBM technology and execution risk. Micron is ramping HBM4 rapidly (about 2x faster than HBM3). However, catching up with Hynix and Samsung requires continued upgrades to increasingly advanced HBM generations, making successful execution critical to its investment thesis.
- US expansion risk. Micron is undertaking a massive manufacturing expansion in the US, with over USD 200bn of planned investment in Idaho and New York. Cost overruns, construction delays or slower-than-expected production ramps could affect returns on that investment (see Appendix B).
Valuation & Price Target
- Micron (MU) is currently trading at 6x forward PE, with earnings up 811% in 2026 (Sep 2026) and expected to grow 126% in 2027E (see valuation comp on page 6).
- Average Wall Street price target is USD 1621.44 per share, implying 56.5% upside from the Oct 8 closing price.
Other Companies (Not Recommended)
- Samsung Electronics (005930.KS): Capacity leader, but not a pure play on memory. Samsung leads in overall DRAM manufacturing capacity (40% of global capacity) and is a solid No. 2 in HBM market share (around 33%). Though memory accounts for over 99% of its operating profit today, Samsung’s DRAM business competes internally with other divisions for capital and resources – from foundry and logic chips to smartphones, displays and consumer electronics. While being a conglomerate offers diversification benefits, it can dilute management focus and make Samsung a less pure play on the Memory Supercycle. We prefer Hynix (HBM technology leadership) and Micron (geopolitical advantage) over Samsung at this juncture. Having said that, we’ll be watching Samsung’s capacity ramp closely, especially in HBM, as both a potential stock catalyst and a competitive threat to Hynix.
- CXMT (688825.CH): ambitious but not yet competitive. Chinese player CXMT is up-and-coming, already the largest DRAM maker in China and No. 4 globally. The firm has a smaller scale (just 9% of global bit supply in 2026), lagging technology and negligible HBM exposure (Table 1) – all reflected in its below-average margins (Table 2). It is also pushing into HBM, but the economics remain challenging due to low yields (reportedly 20-30% vs. 80% at Hynix). Nevertheless, developing a domestic HBM capability is strategically important for China, meaning CXMT will forge ahead despite poor economics. The technological hurdles remain formidable, spanning the EUV wall, die stacking, packaging and TSV bottlenecks – none of which can be easily resolved. Not to mention that ongoing US export restrictions on China form another major constraint. Therefore, we see CXMT as neither a meaningful threat to the industry leaders nor an attractive investment candidate at this stage. At 11.6x forward PE, the stock also trades at a significant premium to its global peers.
Valuation Comp
Source: UOB Kay Hian, Bloomberg, as of 8 October 2026. Note: Micron Fiscal Year ends in August / September.
Credit Metrics
Company | Period | Operating Cash Flow to Interest | Free Cash Flow to Debt | Net debt / EBITDA | Current Ratio |
Samsung | 2Q2026 | 533.40 | 4.06 | -0.73 | 2.83 |
Hynix | 2Q2026 | 423.84 | 2.59 | -0.47 | 2.59 |
Micron | 2Q2026 | 371.97 | 0.51 | -0.16 | 2.90 |
CXMT | 1H2026 | 90.58 | 0.76 | -0.24 | 3.22 |
Source: Companies.
Appendix A: Korean Market De-leveraging Update
Leverage in the Korean stock market has played an important role in memory stock trading, that two of the world’s top three memory makers are primarily listed in Korea. Here is a quick update, supported by data below.
- Institutional deleveraging is largely complete. Sharp declines in hedge fund exposure and leveraged ETF AUM suggest the bulk of the deleveraging has already taken place.
- Retail investors, however, have re-leveraged. Margin financing balances have rebounded despite higher borrowing costs following BOK rate hikes, likely encouraged by the KOSPI’s 32% rebound from its July lows.
| June Peak | July trough | Current level |
KOSPI | ~9,100 | ~5,500 | ~6,600 |
KOSPI Forward PE | ~8x | ~5x | ~5.5x |
KOSPI Volatility | 96 | 55 (August) | 37 |
Bank of Korea Policy Rate | 2.75% | 3.00% | Expecting another 25bps hike in 2026 |
USD/KRW | ~1550 | ~1420 | ~1340 |
Hedge Fund Long/Short Ratio | 5.7x | 3.2x | 3-4x |
Leveraged ETF AUM | ~USD 50bn | ~USD 17bn | ~USD 25bn |
Margin Balance | ~KRW 39trn | ~KRW 27trn | ~KRW 33trn |
Source: JP Morgan, Bloomberg
Appendix B: Data Points on Micron’s US Reshoring Advantage
- Up to USD 6.165bn in CHIPS Act direct funding was awarded for Micron’s leading-edge DRAM projects in Idaho and New York. The funding supports Micron’s commitment to spend approximately USD 50bn by 2030. [ptacts.uspto.gov], [micron.com]
- Micron’s longer-term plans originally contemplated approximately USD 100bn in New York and USD 25bn in Idaho. [ptacts.uspto.gov]
- In June 2025, Micron and the Trump administration announced an expanded plan totaling approximately USD 200bn, comprising USD 150bn in U.S. memory manufacturing and USD 50bn in R&D. The plan was expected to create approximately 90,000 direct and indirect jobs. [investors.micron.com]
- The 2025 expansion added USD 30bn beyond prior plans, including a second leading-edge fab in Idaho, modernization and expansion in Virginia, and advanced U.S. packaging capacity for HBM. [investors.micron.com]
- Micron said these investments support an objective of producing 40% of its DRAM in the United States. [investors.micron.com], [micron.com]
- Micron’s first Idaho fab is scheduled to begin DRAM output in 2027. Its two planned Idaho fabs are expected to create more than 17,000 jobs. [investors.micron.com], [micron.com]
- Micron’s Virginia expansion involves more than USD 2bn of investment and supports more than 3,100 direct manufacturing and community jobs. [micron.com]
- Micron now describes its planned U.S. investment as more than USD 250bn through 2035, although that latest figure extends beyond the original CHIPS-backed commitments.
Disclosures and disclaimers
This report is provided subject to, and must be read together with, the full Disclosures / Disclaimers available at this link, which are incorporated by reference into this report. In particular, this report is intended for general circulation and informational purposes only and does not constitute personal investment advice or a recommendation to buy or sell any investment product or security. You should independently evaluate the information and, where necessary, seek advice from a qualified financial adviser regarding the suitability of any investment. Analyst certifications required under applicable regulations, including SEC Regulation AC (where relevant), are included in this report. By accessing, receiving or using this report, you acknowledge that you have read, understood and agreed to be bound by the Disclosures / Disclaimers, as may be amended, supplemented or updated from time to time.


