

CIO Summary
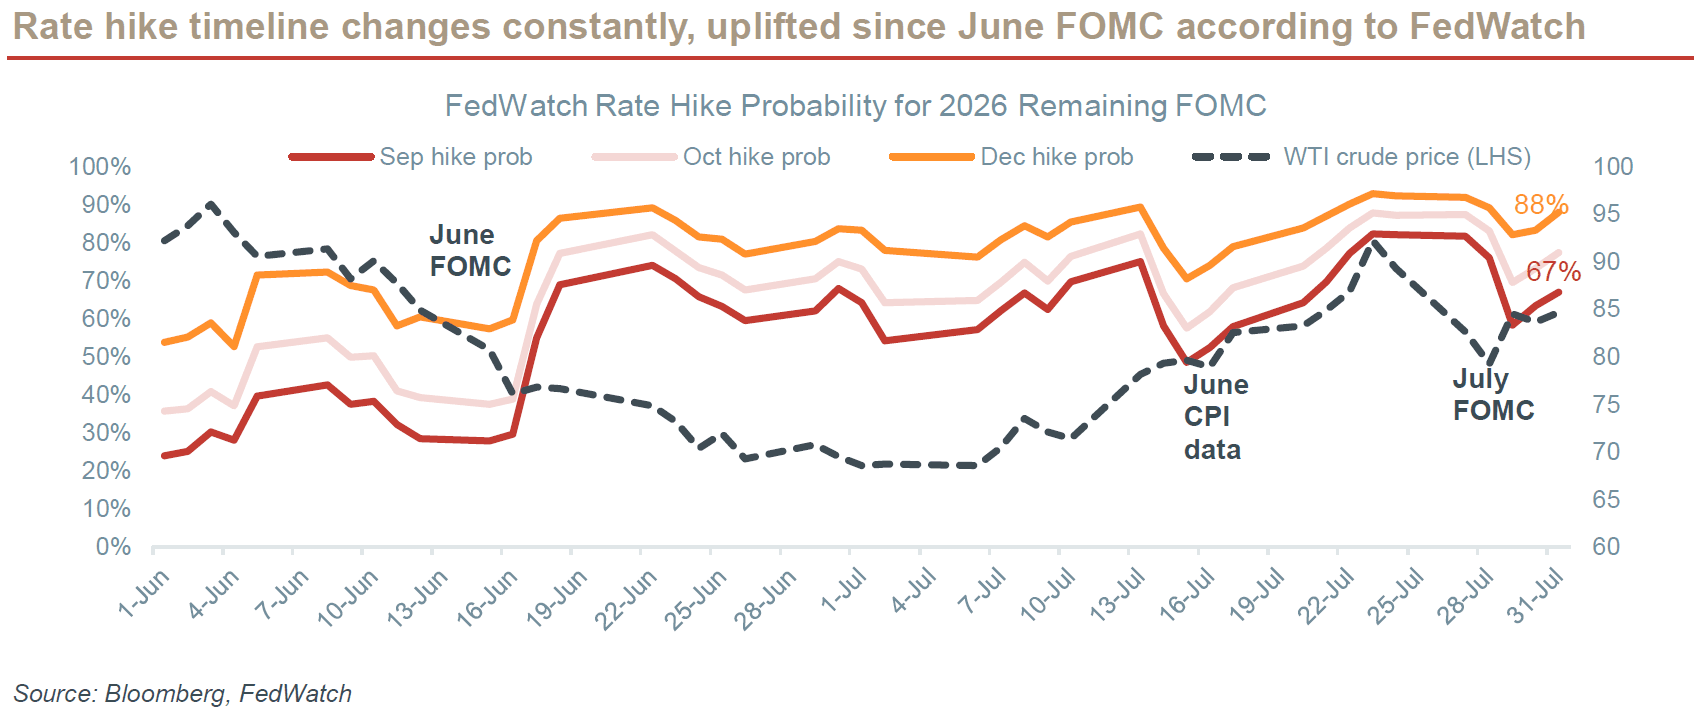
- Short-term: everyone has a view, no one knows for sure. Fed Chair Kevin Warsh’s intentional ambiguity in rate decisions will keep markets guessing – and swinging sharply between our “false hawkishness” and “false dovishness”. Our own educated guess still points to a first rate hike in December, while acknowledging the extreme uncertainty ahead.
- Longer-term: beyond just rates. The real game-changer lies in Warsh’s structural reform agenda, signified by his recent launch of five task forces to overhaul the Fed policy framework. This could deliver tangible results as early as end-2026.
- AI’s broadening market impact. The narrative on AI’s impact on fixed income is rapidly evolving from corporate credit into a paradigm shift at the macro level. The AI Credit Supercycle is now exerting upward pressure on the entire yield curve.
- It may all work out in the end. We see an emerging risk of a self‑reinforcing vicious cycle, where heavy AI‑related debt issuance widens spreads, raises borrowing costs, and forces even more debt issuance. However, this risk could be mitigated by Fed Chair Warsh’s belief in AI’s positive macro potential – provided that AI ultimately delivers the impact that he expects.
- Core Recommendation: remains on high-quality, investment-grade (IG) bonds with short durations (< 3 years).
- Bond highlight: Singapore Airlines SIASP 3.5% 2 Dec 2030
Bond Radar
Below is a list of popular investment-grade (IG) bonds curated by our Products Team. These are for reference only and do not constitute our recommendations. For further details, please contact our fixed-income & credit specialist, Benjamin Tan Shun Chao at benjamintan@uobkh.com
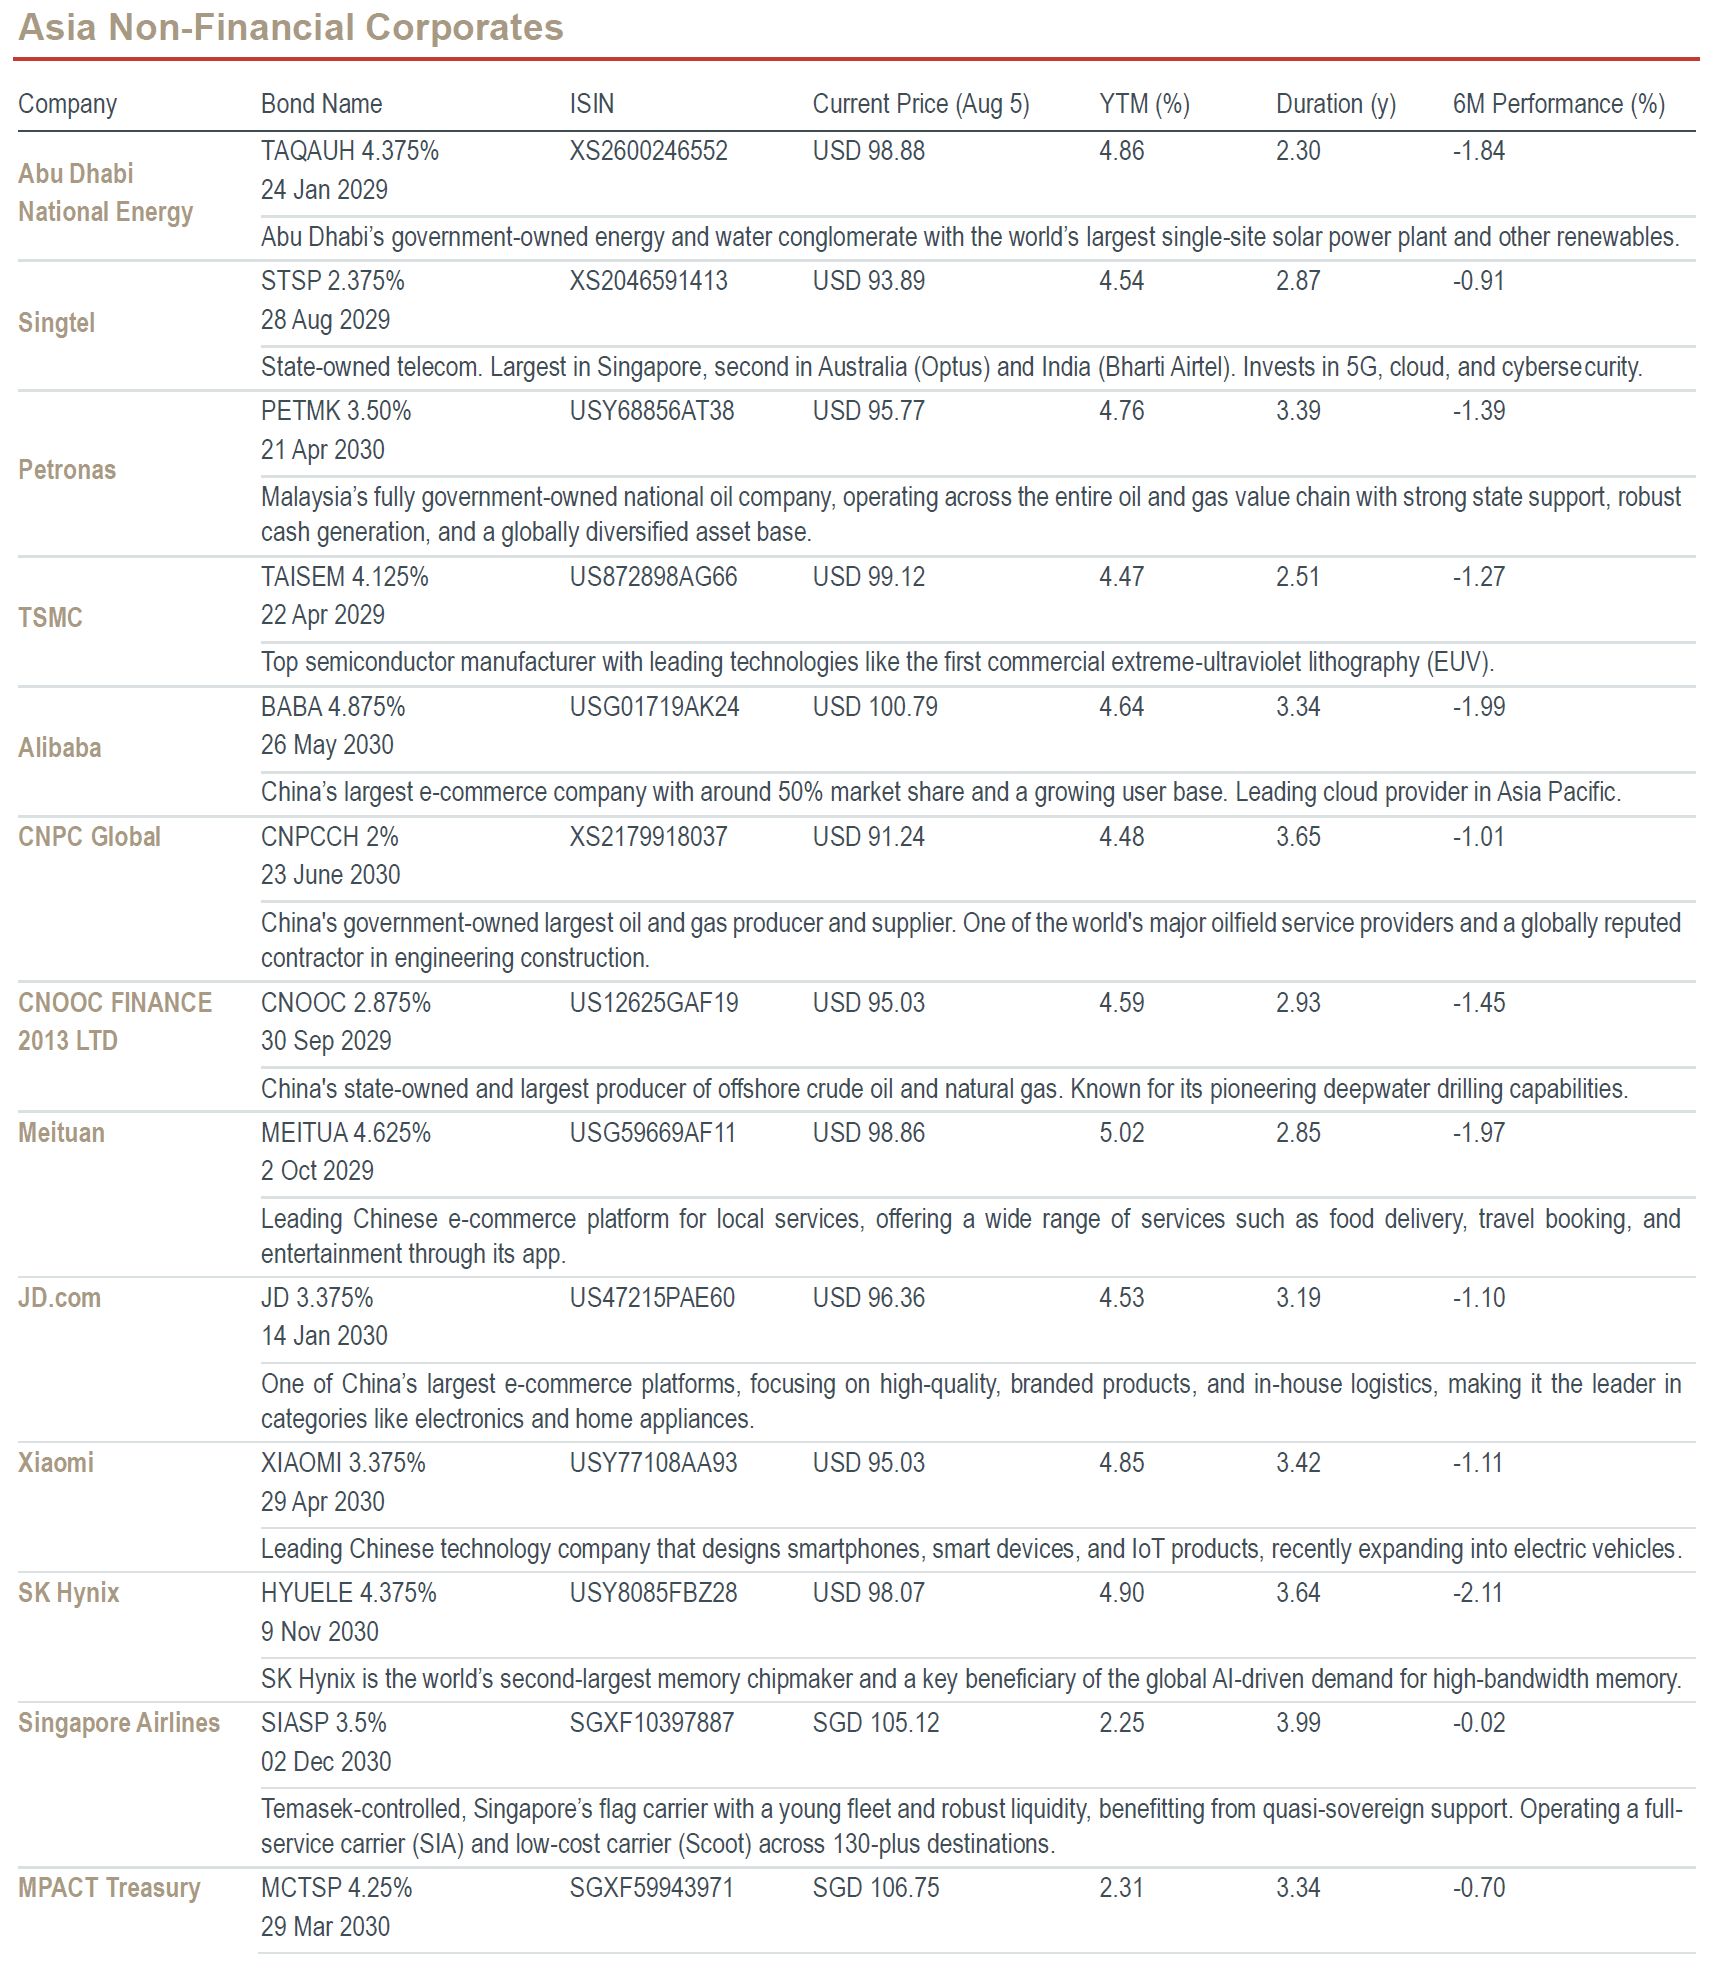

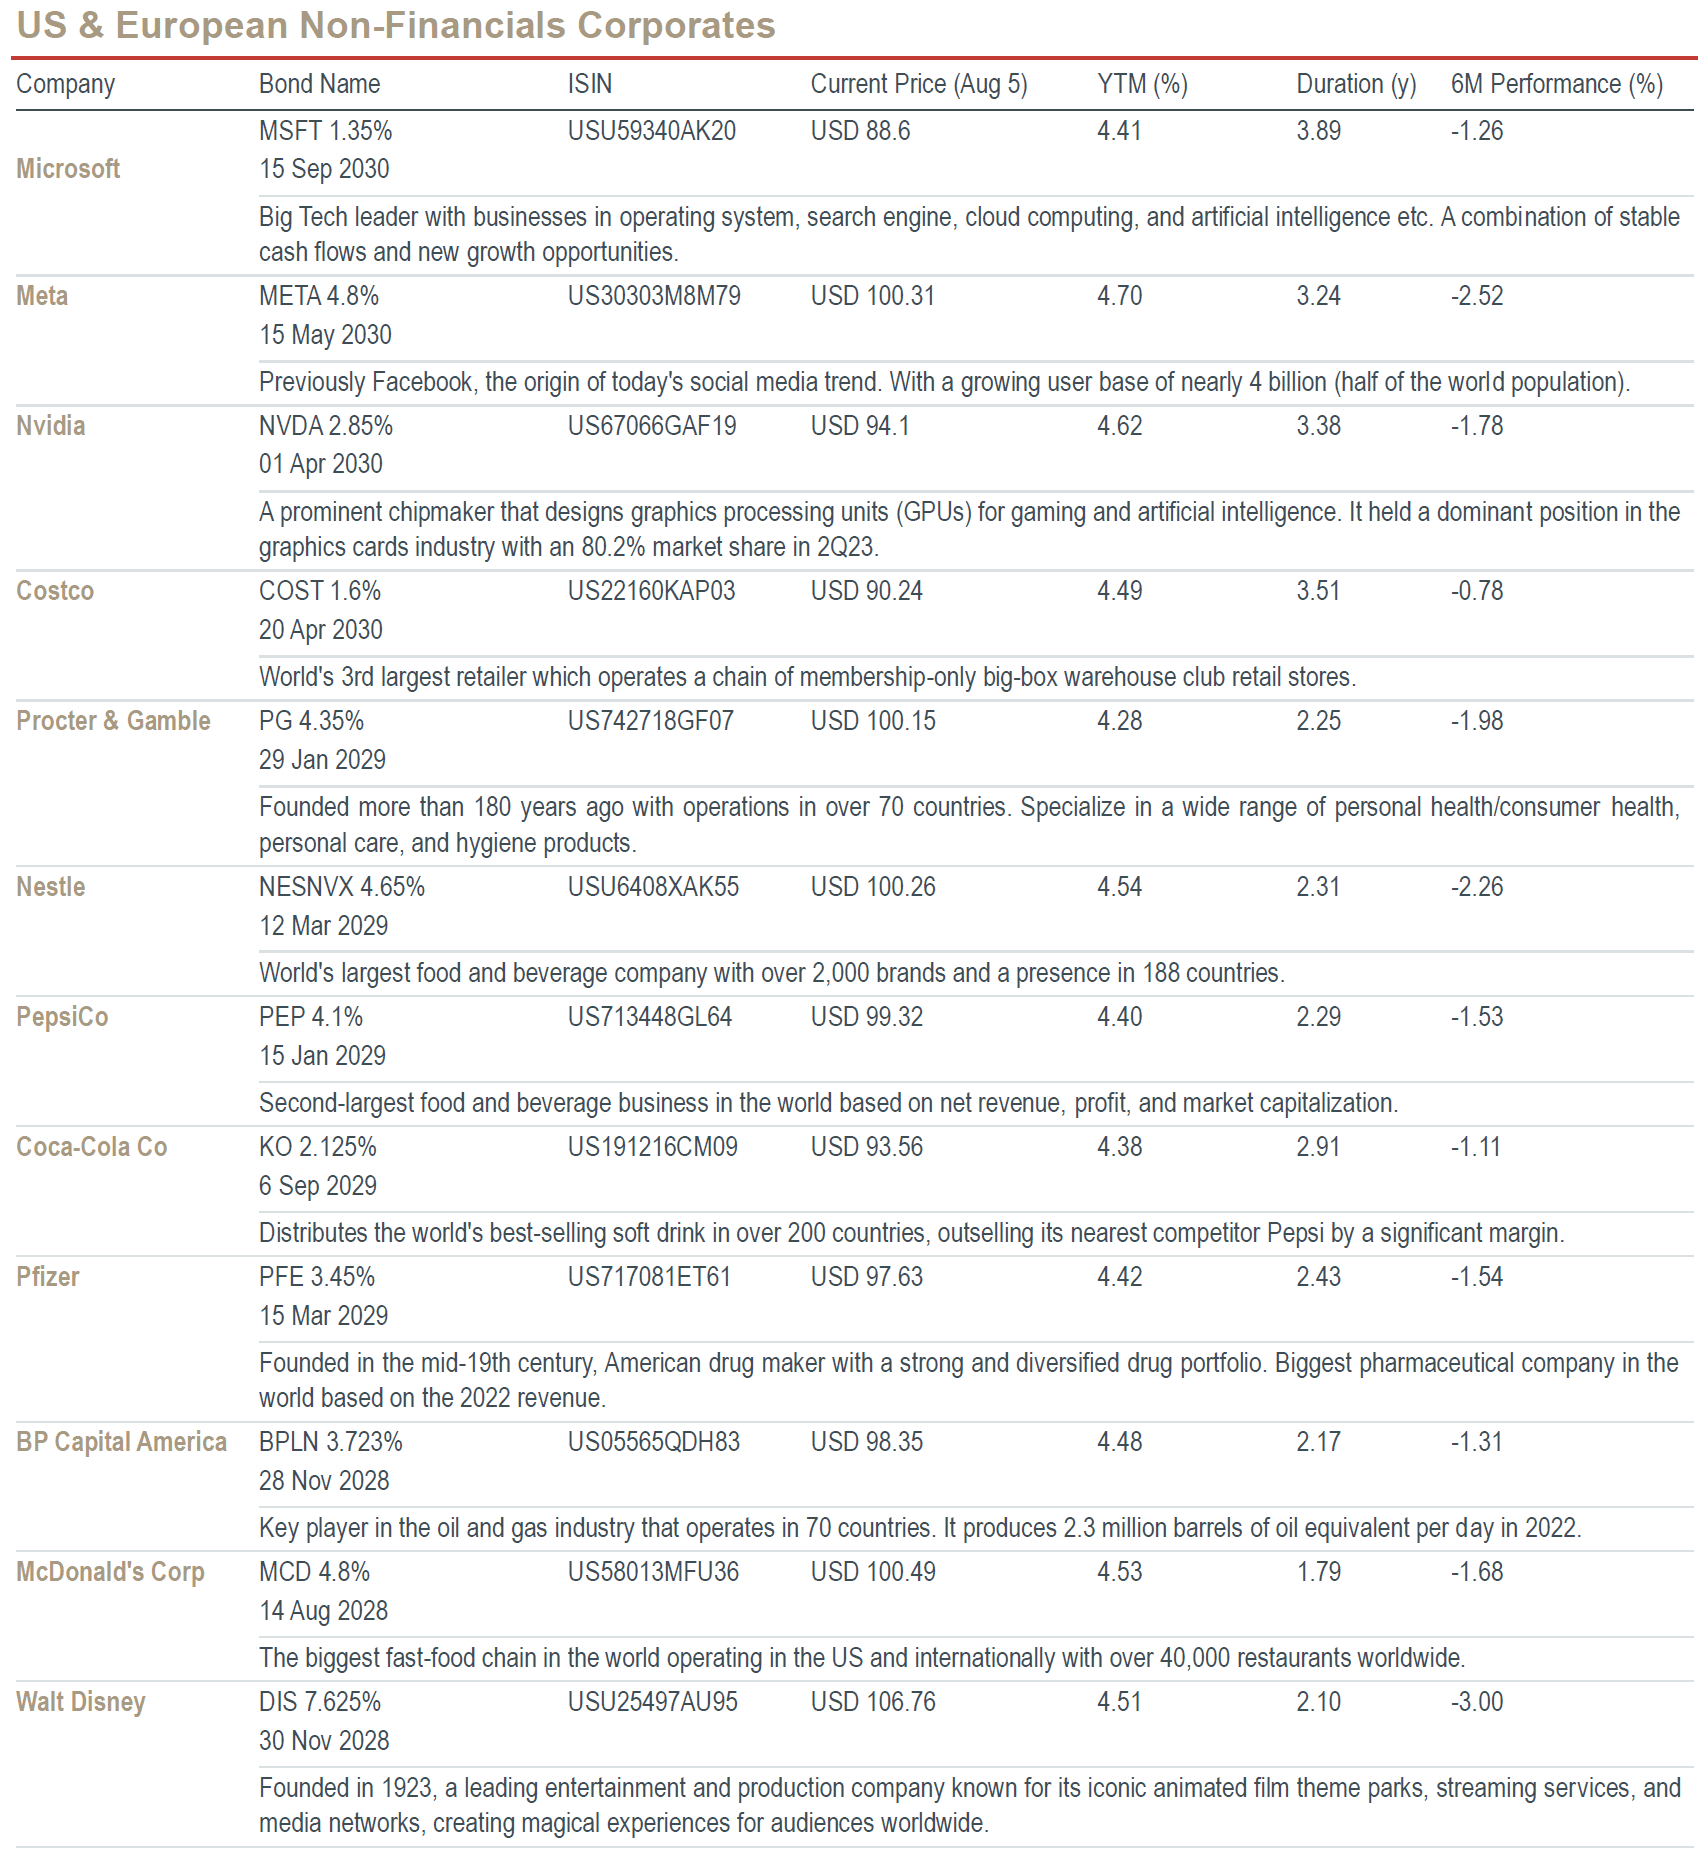

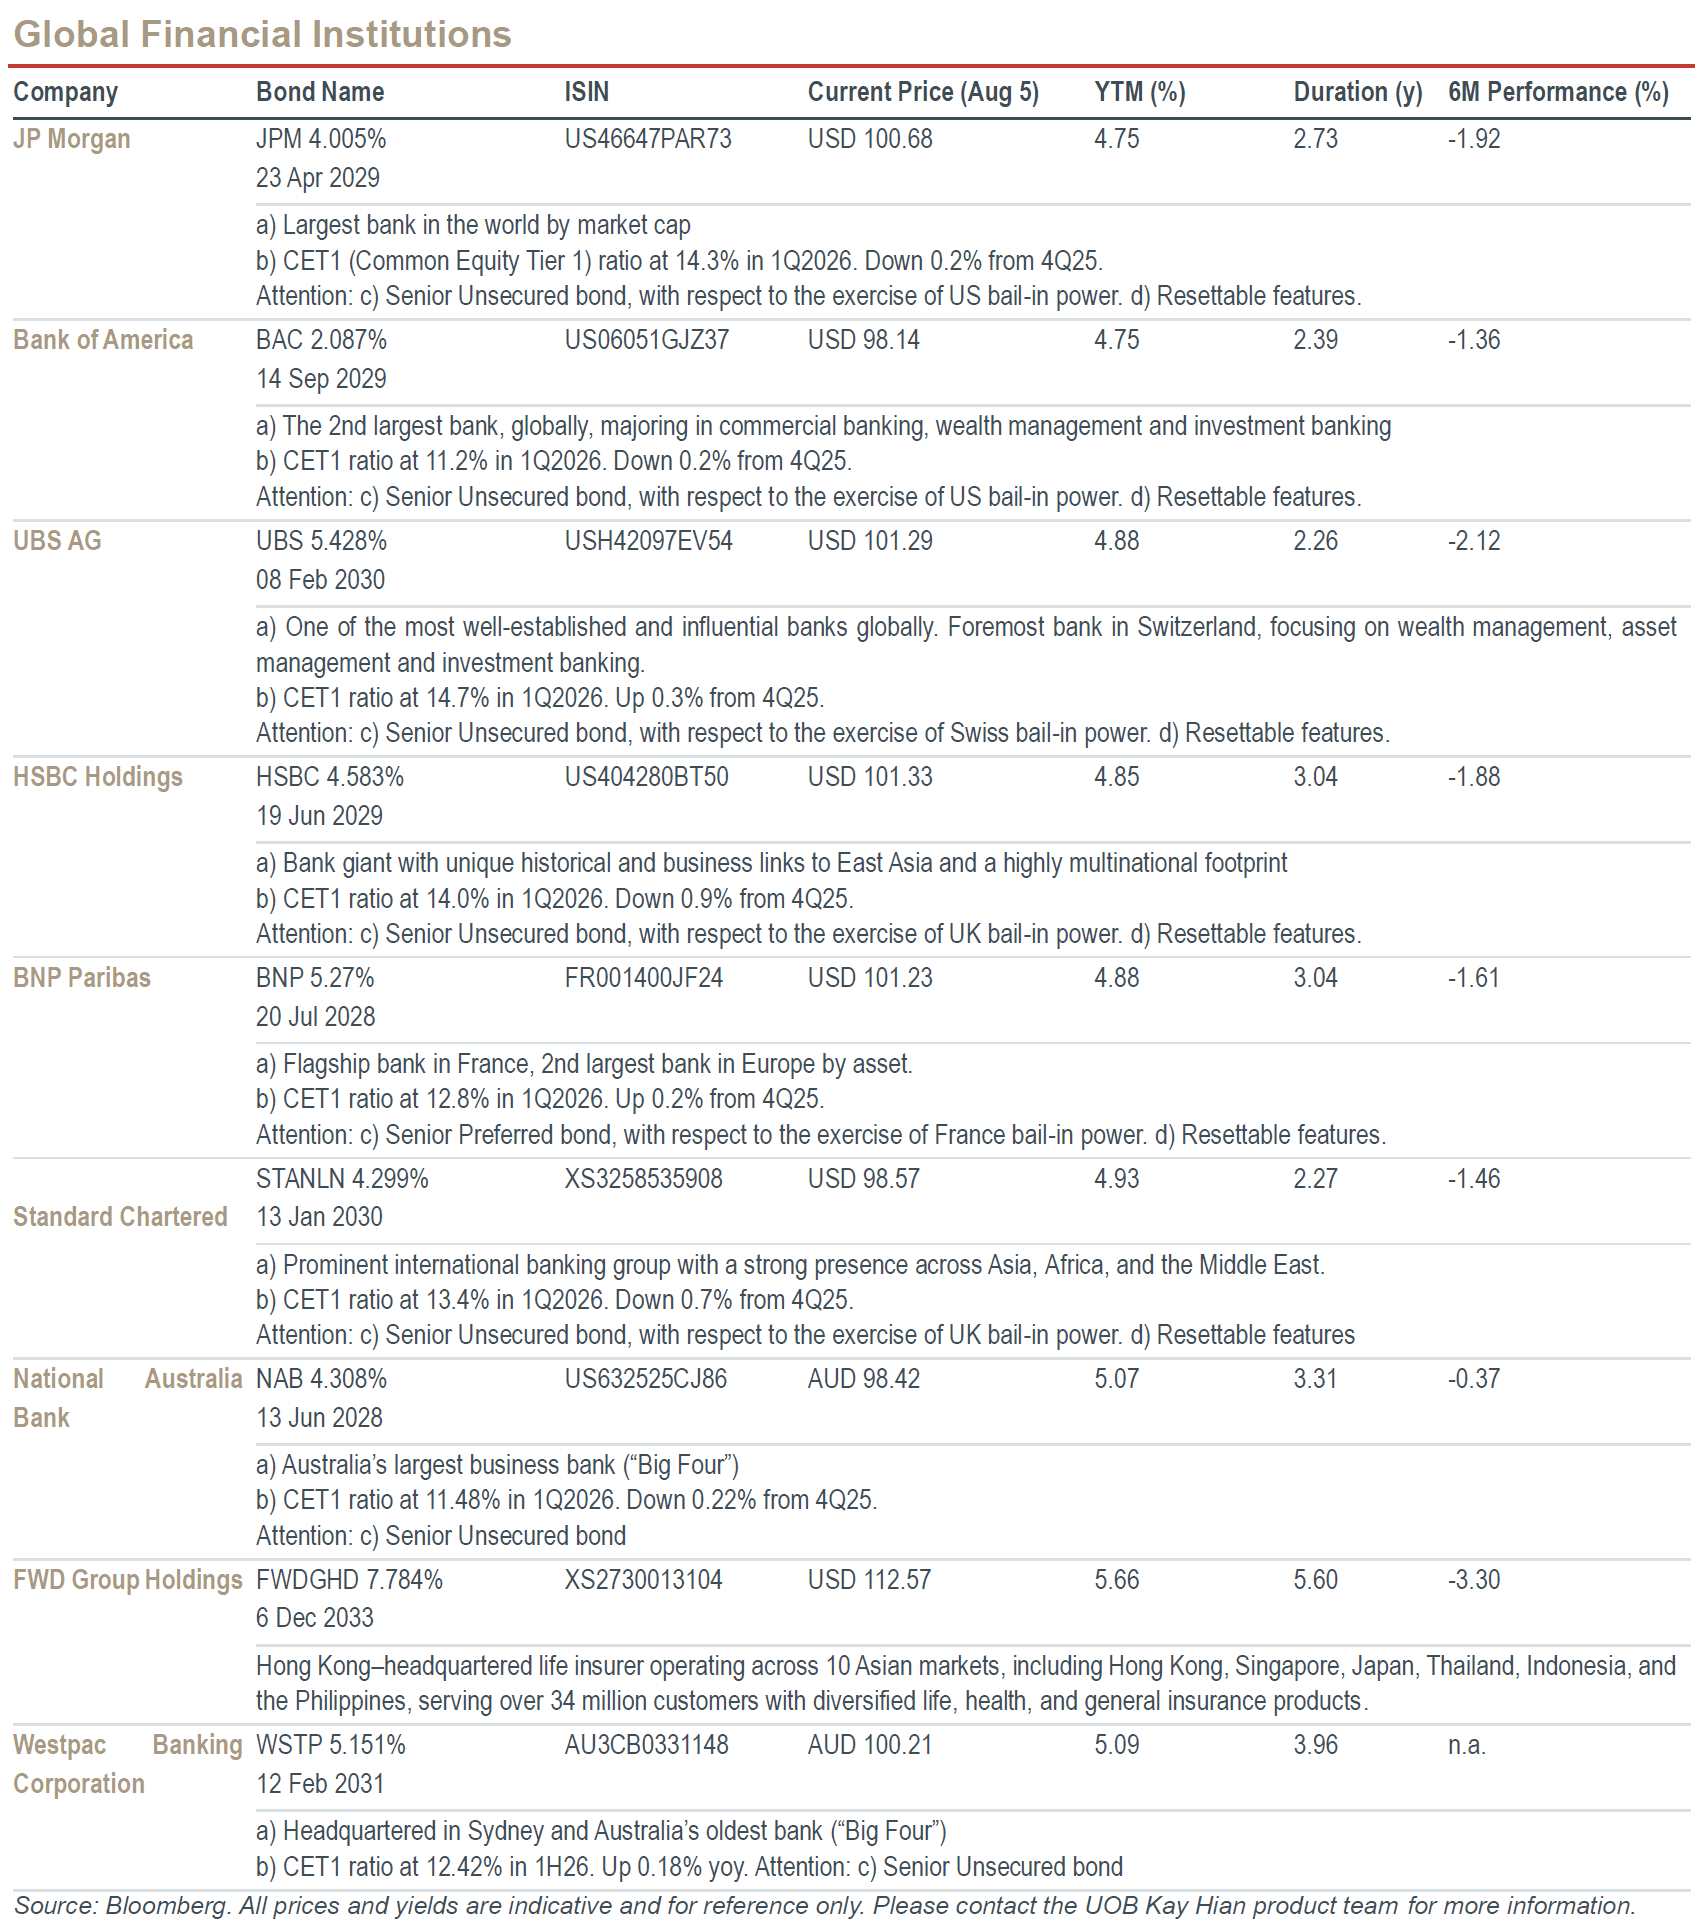
We also offer regular updates on selected bonds from the Bond Radar above. The month’s Bond Highlight is on:
SIASP 3.5% 2 Dec 2030
About the Issuer
Singapore Airlines (SIASP, C6L), or SIA for short, is a leading carrier in Asia and globally, backed by the Singapore government and renowned for its premium service. It operates a fleet of 155 aircrafts, connecting over 130 cities across 60 countries. As of 4 August 2026, SIA has an equity market cap of SGD 23.96bn and cash on hand of SGD 8.51bn. The company has SGD4.02bn of bonds outstanding, with an average maturity of 3.97 years and an average fixed coupon of 3.45% (source: Bloomberg).
Investment Thesis
- Strong sales underscore resilient demand. 1Q2027 revenue rose 19.3% YoY, supported by higher passenger revenue and a 12.7% increase in passenger yield (revenue / kilometers).
- Weak earnings pressured by costs. Operating profit fell to SGD 106mn as fuel costs surged, while associate Air India remained a drag on group earnings.
- Quick recovery expected. UOBKH expects 2Q2027 earnings to rebound to SGD 240mn–SGD 460mn, underpinned by better fuel-cost pass-through and lower jet fuel prices quarter on quarter.
- Balance sheet remains a key credit strength. Despite a weak quarter, UOBKH estimates that SIA’s net cash position has improved to around SGD 3.3bn, supporting bond repayment capacity.
- Credit risks manageable. Elevated fuel prices, weaker travel demand and prolonged Air India losses remain key risks, but SIA’s strong liquidity and low leverage provide a meaningful buffer.
- Strategic shareholder support. Temasek’s 50.6% stake and SIA’s importance as Singapore’s flag carrier provide additional credit comfort, though the bond is not explicitly government guaranteed.
Financial Highlights (1Q2027)
- Operating cash flow to interest expense: 34.61x. Robust interest coverage and ample debt-servicing buffer.
- Free cash flow to total debt: 16.09%. Healthy internal cash generation relative to total borrowings.
- Net debt / EBITDA: 0.44x. Low leverage provides SIA with a strong buffer against higher fuel costs, weaker demand and other macro headwinds.
- Current ratio: 0.97x. Slightly below 1.0x but manageable given SIA’s sizeable cash balance, committed credit lines and normal airline working-capital profile.
- Return on invested capital (ROIC): 5.6%. Moderate returns reflect the capital-intensive nature of aviation and current pressure from fuel costs and associate losses.
- Altman Z-Score: 1.43. This appears weak on the surface, but it likely overstates the actual default risk given SIA’s strong credit metrics and implicit government backing.
Macro Comments
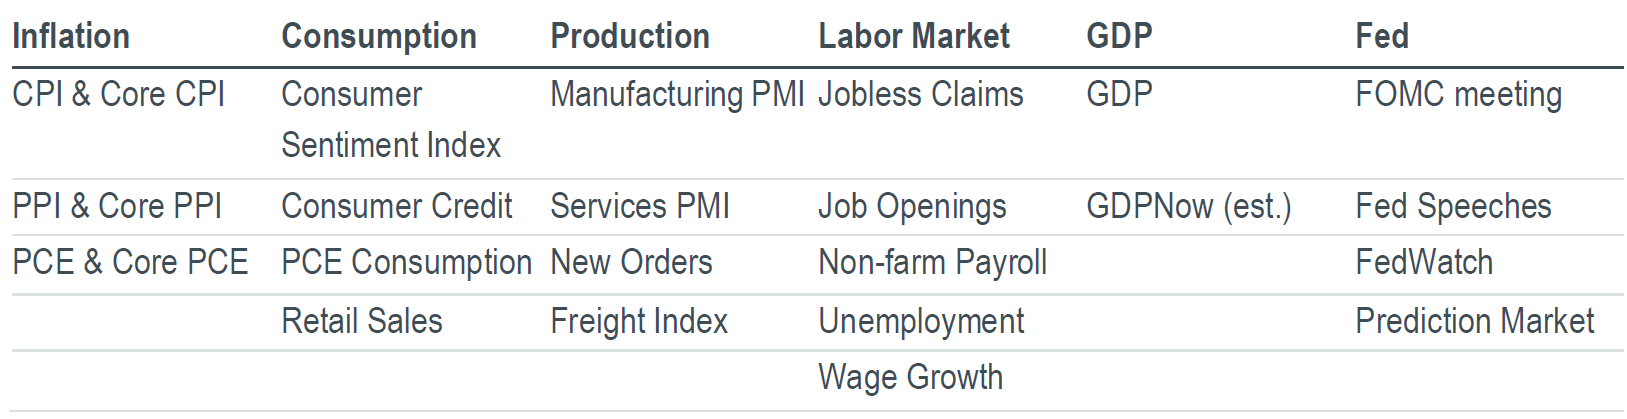
We track the following US economic data to understand the Fed policy and interest rate changes. We then selectively comment on a few of the indicators, those that we deem the most relevant.
Key conclusion: Fed Chair Kevin Warsh’s intentional ambiguity in rate decisions will keep markets guessing – and swinging sharply between our “false hawkishness” and “false dovishness”. Our own educated guess still points to a first rate hike in December, while acknowledging the extreme uncertainty ahead. Regardless, the real game changer lies in Warsh’s structural reform agenda for the Fed.
- Fed Policy (July FOMC). The latest FOMC held rates steady against hawkish market expectations. The Committee voted 9-3 to hold the target rate at 3.50-3.75% for the fifth consecutive time, signaling a further widening divergence within the Fed. Chair Warsh’s press conference sparked sharply divergent interpretations, reinforcing our view of his intentional ambiguity. The following illustrates why the market can often swing between our “false hawkishness” and “false dovishness”:
o False dovishness: Warsh refused to label the July decision as a "pause", and reiterated his commitment to the 2% inflation target ("not hesitate to act" when necessary).
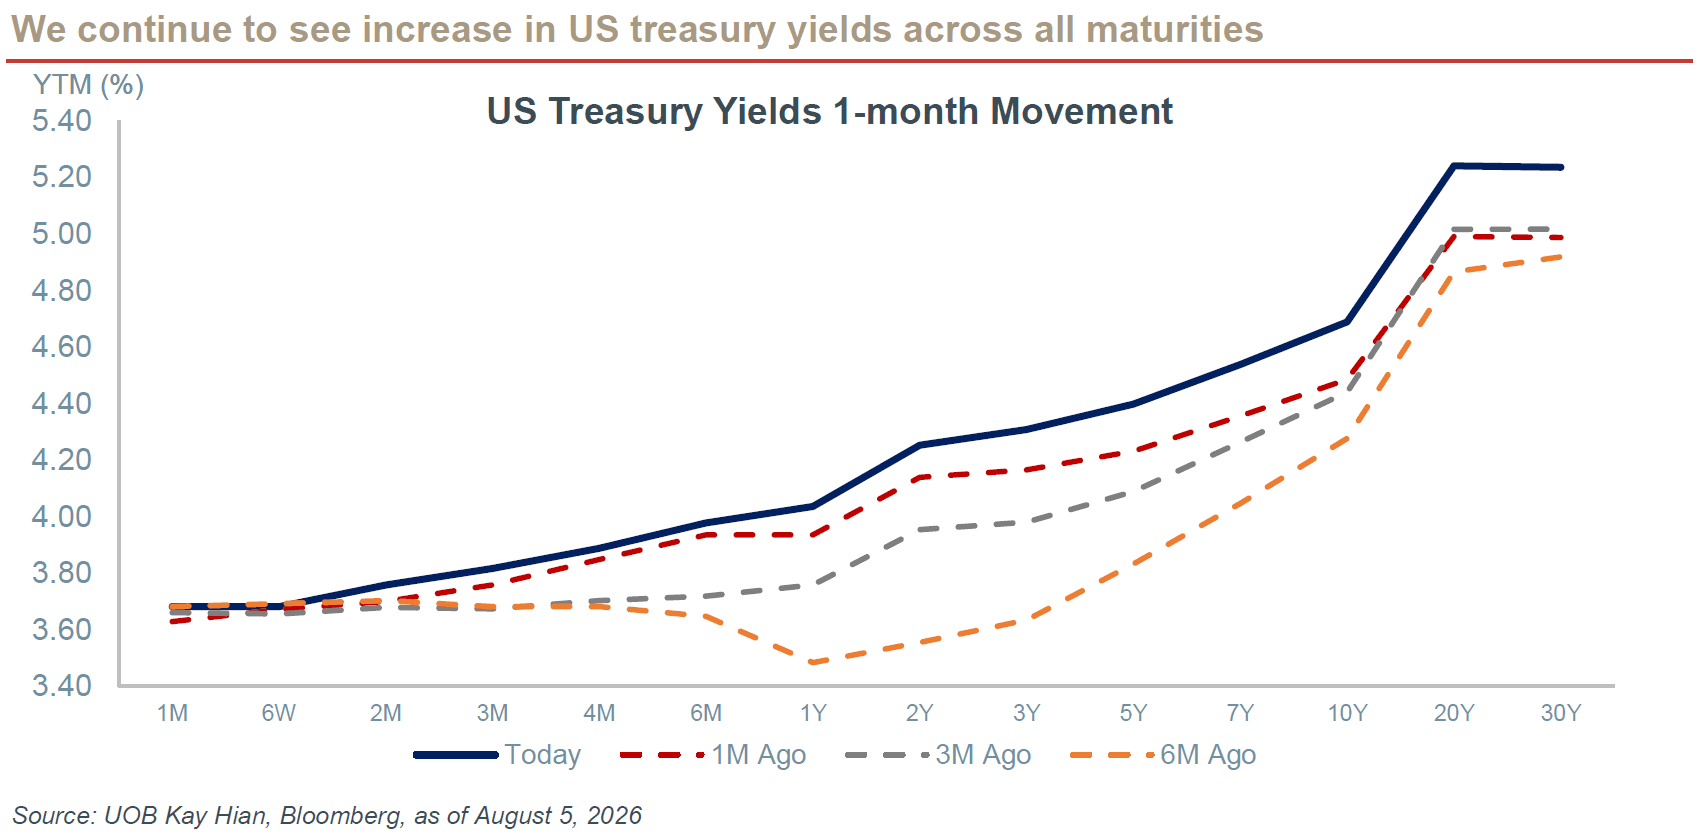
o False hawkishness: Warsh recognized that the spontaneous surge in long-term treasury yields since mid-June has effectively "done much of the Fed's work” (effective tightening).
We maintain our view that Warsh is a reformist, and his primary focus is on long-term institutional overhaul rather than near-term rate calculus. Therefore, his five new task forces (inflation framework, communications, balance sheet, data sources and productivity) will be more important to watch. Tangible Fed reforms will likely be unveiled before the end of 2026.
- Inflation (June CPI, PCE and trimmed PCE). June data eased market concerns of reaccelerating inflation: core CPI came in flat, with YoY reading dropping to 2.6%. The cooling was broad-based, as energy prices trended down in June (as we noted in the last Fixed Income Monthly), combined with a renewed slowing in shelter inflation. June PCE also offered a downside surprise, with core PCE (Fed’s current preferred inflation measure) printed a mild 0.13% MoM increase. Notably, if we look at trimmed PCE, Kevin Warsh’s favorite gauge, the June reading was merely +2.2% over the last 12 months, down from 2.4% in May and moving closer to Fed’s 2% target.
- GDP (2Q2026 GDP). The advance print for 2Q2026 real GDP was merely 1.5% annualized, below market expectation of 2.0% growth. The underlying GDP composition reveals continuous resilience of the US economy, with consumption rising 3.2% (likely reflecting the World Cup boost) and equipment growth up 15.2% (likely due to the AI boom). A notable divergence is the income-expenditure dynamic: in 2Q2026, personal disposable income declined 0.38% QoQ, while personal consumption expenditures expanded 0.78% QoQ. It seems that a persistent drawdown of household buffers has pushed the personal savings rate down to 2.7%, raising questions about the sustainability of consumer-led growth into 2H2026.
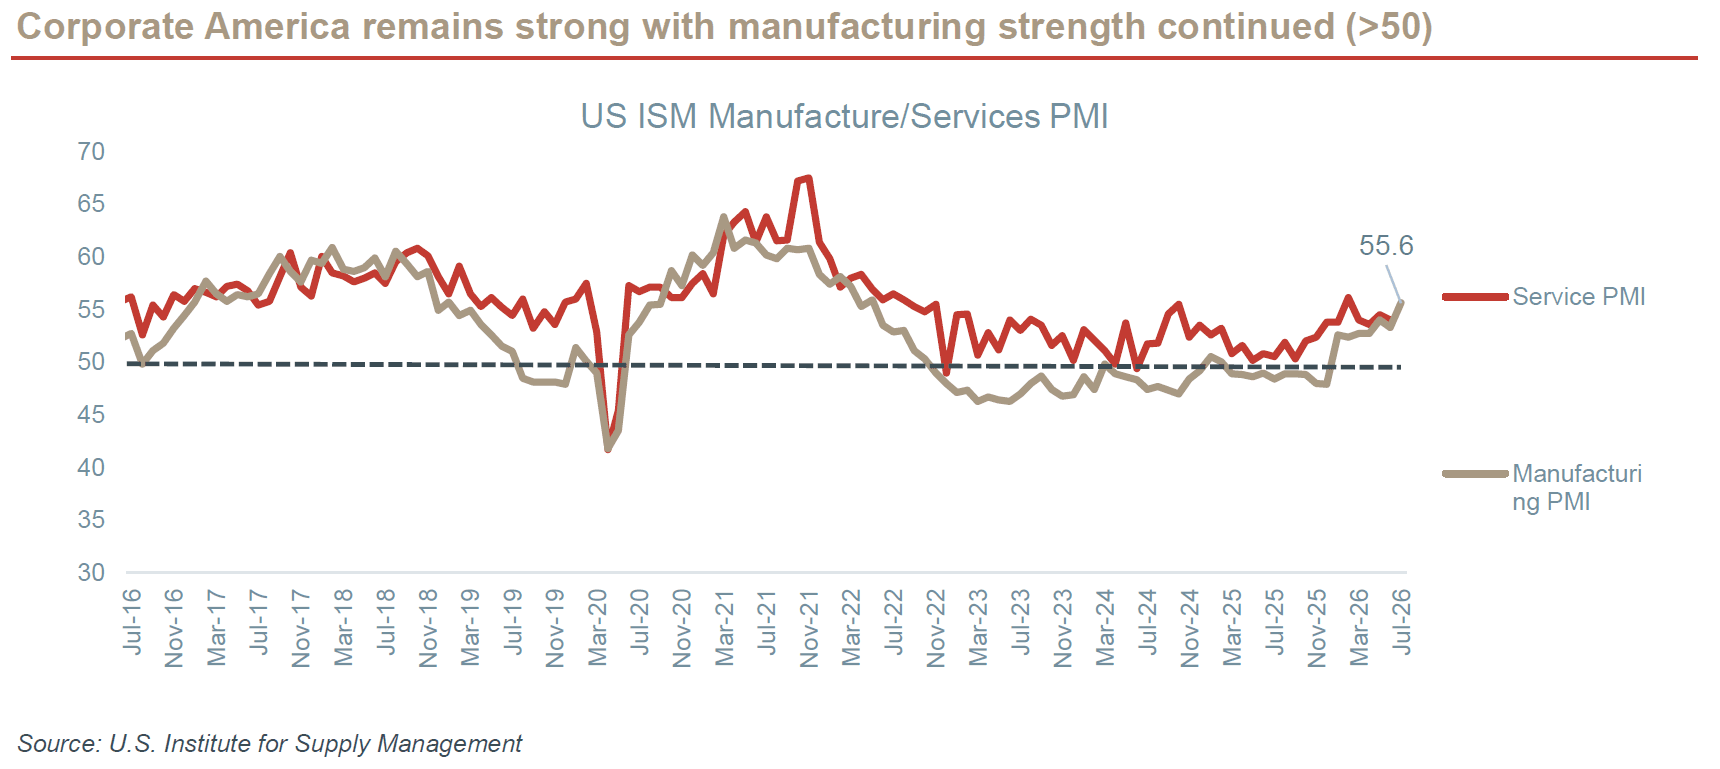
- Production (July Manufacturing PMI). Corporate America’s industrial base continued to demonstrate resilience. The ISM Manufacturing PMI surged 2.3 index points to 55.6 in July, exceeding market expectations and marking its highest reading since May 2022. The underlying composition was broad-based, with meaningful expansions across new orders, production, and employment sub-indices, confirming a reacceleration in US factory activities.
Hot Topic: Widening AI Spreads Meet “Higher for Longer” Worries
Today, you can’t possibly analyze or discuss any investment topic without bringing AI into the discussion – fixed income included. The narrative surrounding AI’s impact on fixed income is rapidly evolving from corporate credit into a paradigm shift at the macro level.
- The AI-Fed Collision. Following our June discussion on the "4.5%+ Yields New Regime" and July’s introduction of the "AI Credit Supercycle," the latest market data points to a critical convergence: the sheer scale of AI-related debt issuance is colliding with a "higher for longer" rate environment, triggering a notable widening in AI credit spreads.
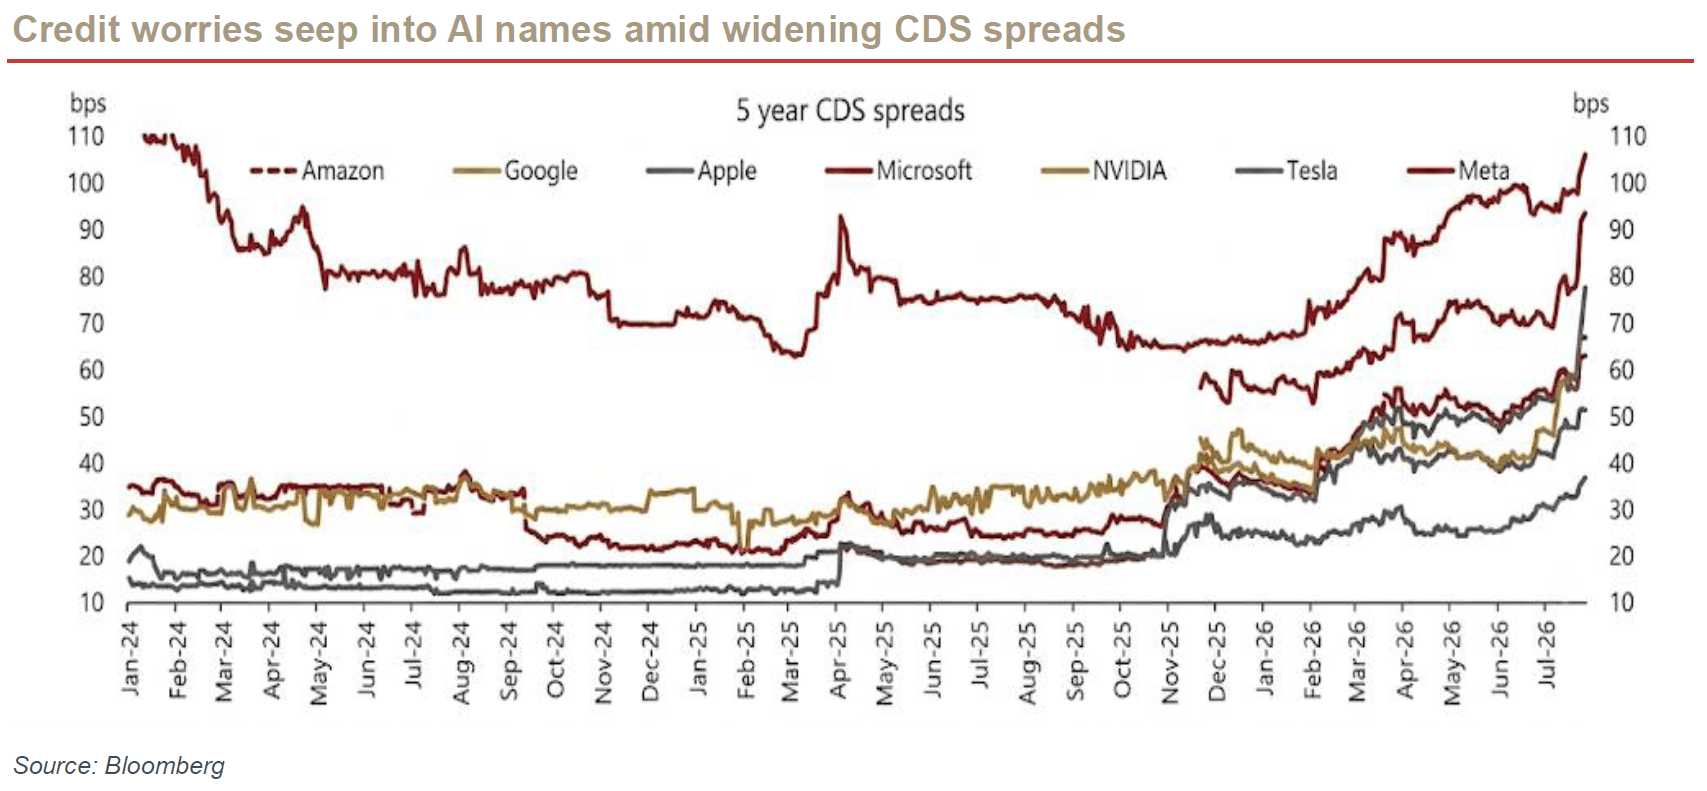
- What the CDS market tells us. As shown in the chart below, the cost of hedging against AI company credit risk is rising rapidly. The 5-year credit default swap (CDS) for AI bellwethers has widened significantly YTD, with Oracle’s 5-year spread trading above 200 bps as of July 2026. While the market remains positive on AI’s long-term earnings potential, it is still testing near-term cash flow resilience and digesting an unprecedented amount of new debt supply. According to Goldman Sachs, hyperscalers (Amazon, Microsoft, Alphabet, Meta, Oracle) are on track to issue roughly USD 250bn in 2026 (a ~2.5x increase) and ~USD 400bn in 2027 (4x pre-surge levels).
- The AI Credit Supercycle. Debt issuance by itself doesn’t mean distress, but the sheer size could lead to a broad, structural shift in market conditions. Historically, every major tech revolution—from canals and railways to electrification and telecommunications—was financed through debt and leverage. The current cycle may not be any different. However, such a concentrated influx of highly rated supply can quickly absorb market liquidity, crowding out other corporate issuers and increasing market fragility. In the USD IG market alone, AI-related supply has generated a record 23% of total gross issuance. Consequently, the structural supply headwind is exerting upward pressure on the entire yield curve and compressing the spread cushion.
- Short-term risk of a self-reinforcing vicious cycle. The above dynamic has the structural setup to become a negative feedback loop, driven by a concentrated debt supply shock. Namely, a massive AI-related debt issuance could continue to widen spreads, raise borrowing costs and force companies to issue even more debt. Both J.P. Morgan and Goldman Sachs have alluded to this (see the US Credit section below).
- Long-term relief from Fed policy flexibility. Kevin Warsh has been a vocal supporter of AI’s positive macro potential, making him the first Fed Chair after Alan Greenspan to formally integrate technology‑driven productivity gains into the central bank’s policy framework. Warsh believes that AI can structurally raise the economic growth potential while easing inflation pressures, giving the Fed greater flexibility in guide policy toward its estimated neutral rate. This should mitigate the risk of a supply-driven negative feedback loop triggered by AI credit. The critical assumption here is that AI ultimately delivers the impact that Warsh envisions.
Credit View
US Credit: Stay Disciplined, Stay Short
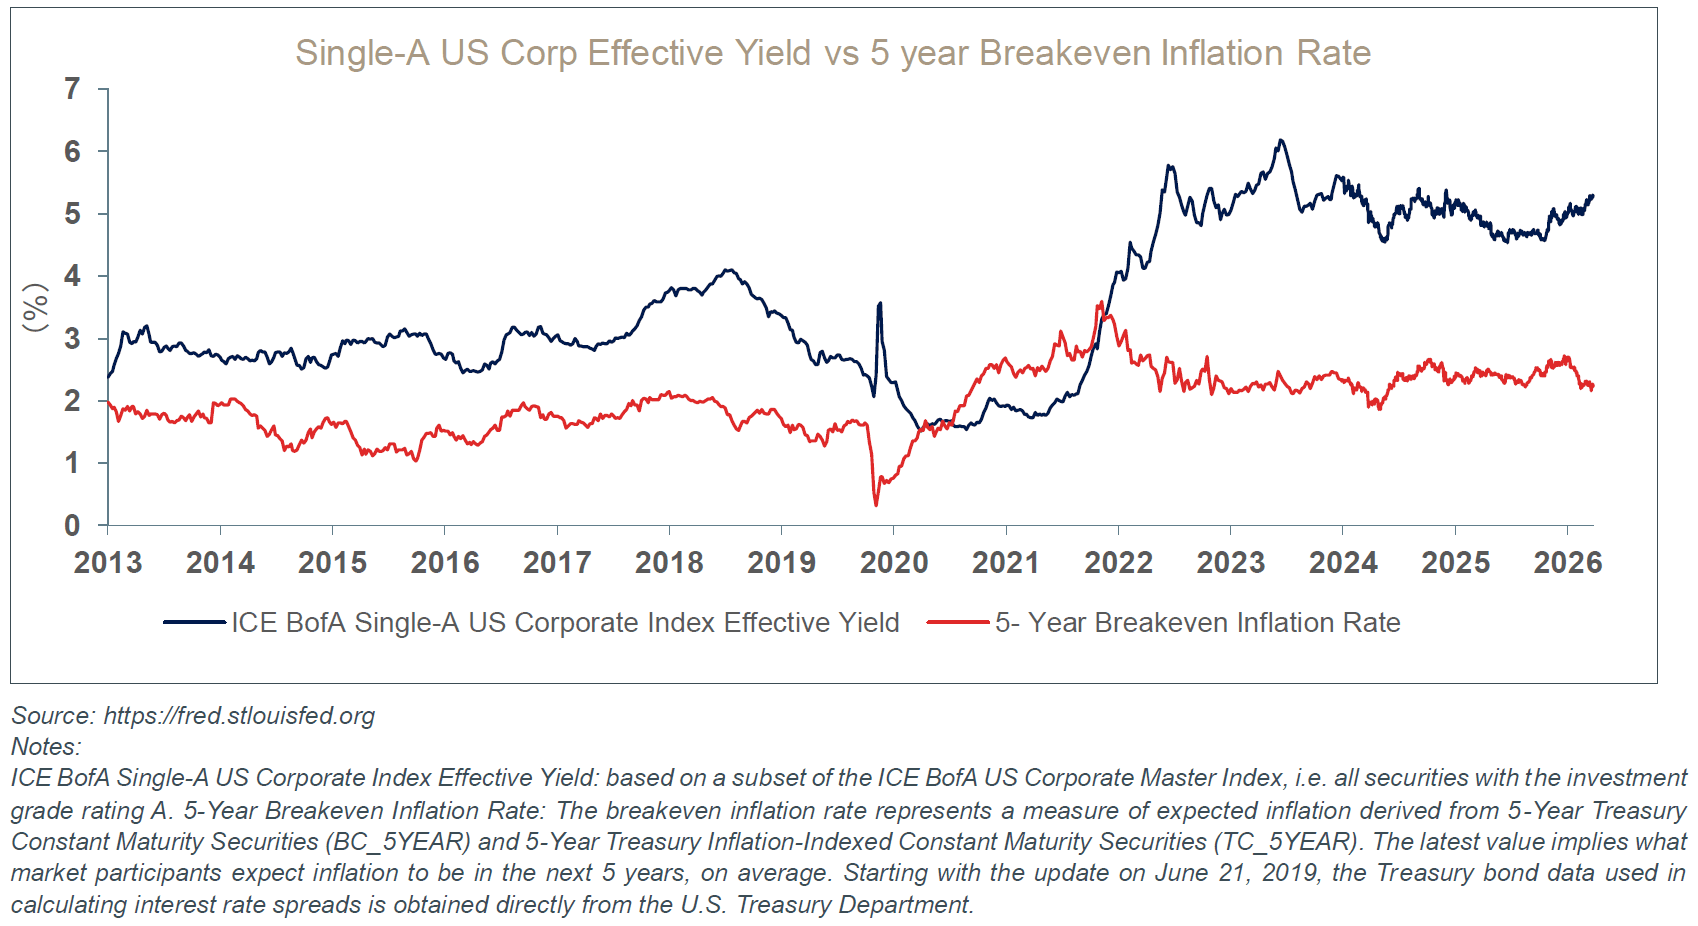
US IG credit remains broadly supported by attractive all-in yields, but the market is becoming more selective as rate volatility and AI-related supply weigh on spreads. In the current environment, we expect US IG spreads to remain range-bound, with income carry remaining the main driver of returns rather than aggressive spread compression.
- J.P. Morgan calls the hyperscaler repricing moment. The firm noted that long-end yields are at the highest level since Nov 2023, which should attract yield seekers, although the support is less certain this time as the market is expecting two rate hikes through mid-2027 and geopolitical risks remain unresolved. As noted above, the key theme remains repricing of hyperscalers and other AI-related issuers, which J.P. Morgan described as a "tale of two markets" in IG – with hyperscalers widening significantly more than the rest of the index. July was also the second-highest month ever for its gross technology supply of USD 49bn, representing a record 34% of total monthly issuance. This further explains why technical pressure becomes the key spread driver.
- Goldman Sachs highlighting the sheer scale of AI funding. The firm estimates USD 489bn of AI-related debt issuance so far this year, already above its full-year 2025 estimate of USD 322bn. Importantly, only around 40% of this was directly issued by the hyperscalers, with the rest from independent data centres, semiconductors, software, equipment and other parts of the AI ecosystem. AI-related issuance now accounts for 23% of USD IG gross supply and 20% of USD HY gross supply. This is no longer just a Big Tech story; it now carries broader market implications.
- Rising rating agency scrutiny. There has not been a broad downgrade cycle for the US hyperscalers, but rating agencies are increasingly concerned about AI-related balance sheet pressures. A Moody’s-related article flagged that unprecedented AI capex is eroding free cash flows and increasing financial risks for hyperscalers such as Amazon, Meta, Alphabet and Microsoft – even though these issuers still maintain some of the strongest balance sheets globally. In addition, data center lease obligations could become a growing focus for rating agencies over time. Goldman Sachs estimates that hyperscaler lease obligations total roughly USD 1.2tn, including USD 725bn of leases not yet commenced.
Our emphasis on emerging credit risk does not imply a bearish stance. We remain constructive on US IG credit, while advocating a more disciplined approach. We hereby reiterate our Core Recommendation on high-quality, investment-grade bonds with short durations (< 3 years).
Asia Credit: Quality Carry Amid AI Repricing
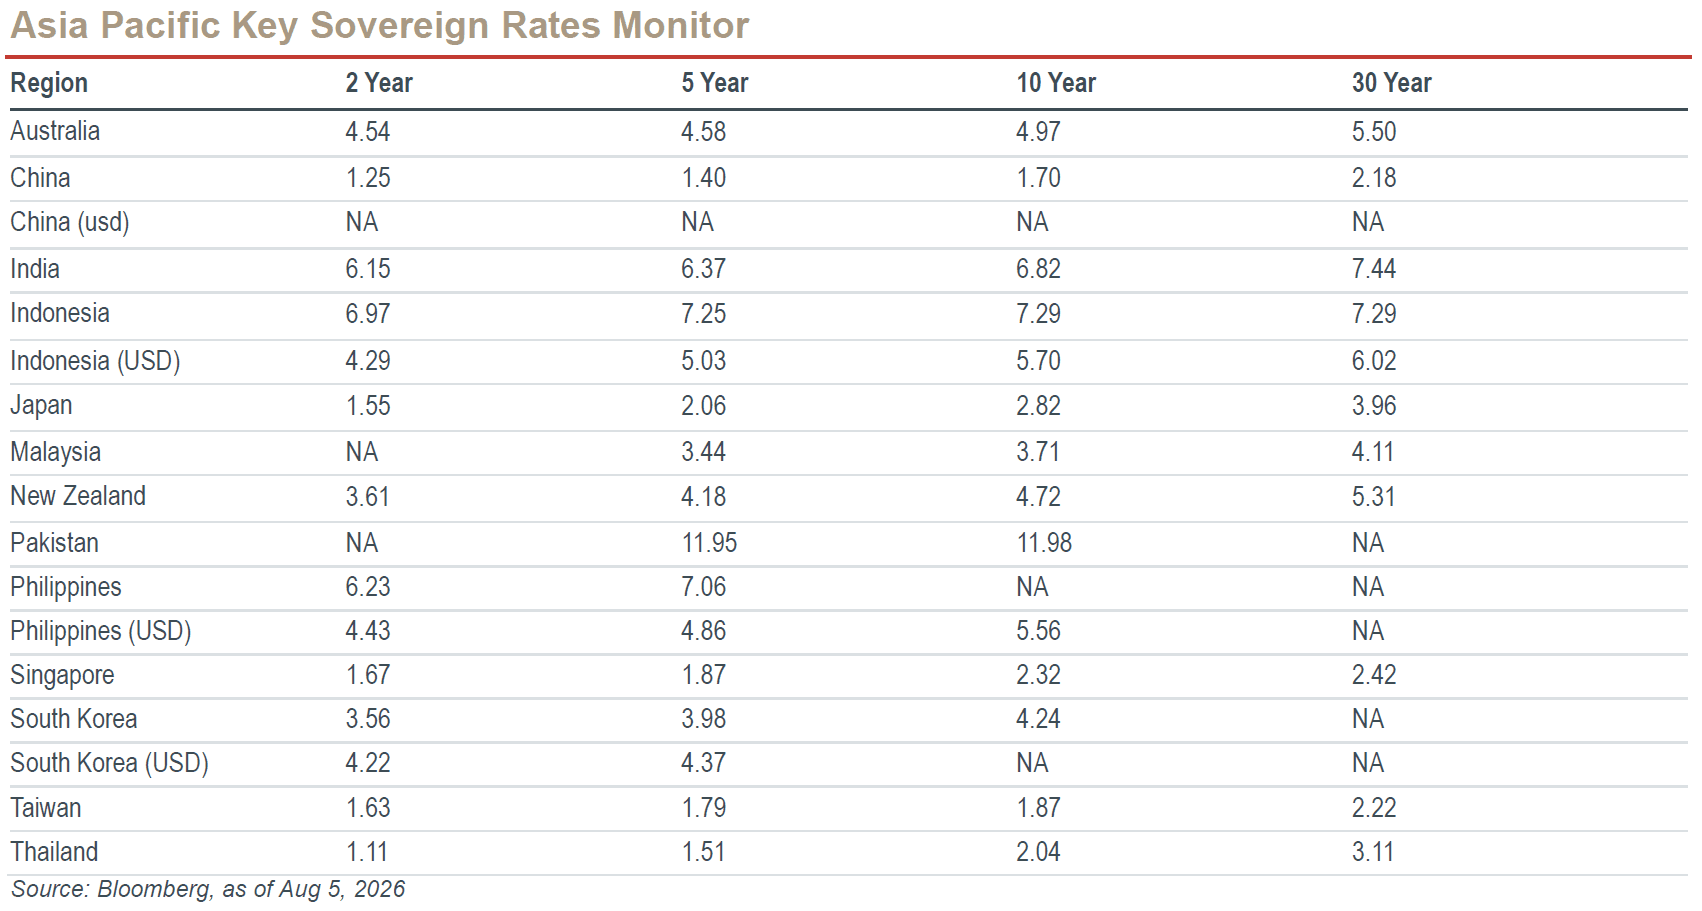
Asia credit remains resilient despite higher global rates and tighter spread valuations.
- J.P. Morgan views rate volatility as a key risk. The firm noted that the Asia credit market gained modestly in the final week of July, bringing YTD return to around 0.4%. Spreads tightened 1 bp to 88 bps and remained within a narrow July range of 83–94 bps. The key risk is no longer credit fundamentals, but rate volatility, especially if confidence in the Fed weakens and long-end Treasury yields stay elevated.
- Bloomberg zeroes in on the Asian AI theme. The AI theme is increasingly relevant for Asia credit, but with a slightly different angle from the US. Bloomberg Intelligence noted that both SK Hynix and TSMC bonds have slightly underperformed the Bloomberg Asia USD Credit Total Return Index YTD. Their record AI-driven revenues raise concerns over sustainability of their customers’ spending. However, credit quality remains supported by their robust earnings and strong balance sheets, with both issuers retaining high-grade strength.
- Moody’s upgrades SK Hynix. The rating agency recently upgraded of Hynix and its senior unsecured ratings from Baa1 to A3, with a stable outlook. Moody’s noted that the change reflects positive expectations for Hynix’s profitability and cash flow generation over the next 12–18 months, which will likely strengthen its balance sheet and provide a meaningful buffer against the next memory industry downcycle (if any).
- Singapore bank credit remains one of the most defensive areas in Asia, supported by sound asset quality, strong capital buffers and easing commercial real estate risks. Bloomberg Intelligence noted that Singapore banks’ CRE loan risks should ease further in 2H, as most weak CRE loans had already been recognized as impaired in previous years. Hong Kong property conditions are also showing signs of stabilization. DBS’s real estate exposure remains mostly high-quality, while OCBC and UOB continue to benefit from prudent lending standards and low loan-to-value ratios. These factors combined continue to support the resilience of Singapore bank USD bonds, although spread tightening may be limited as strong credit profiles and low bond volatility are already priced in.
- We also continue to see value in AUD credit and Asia bank capital as diversification tools. Bloomberg Intelligence highlighted that the Ausbond Credit Index has an average A1 rating, around two notches higher than Asia ex-Japan USD credit high grade and US IG peers, while offering shorter duration and comparable or higher spreads. This supports the case for AUD credit as a way to diversify away from USD exposure (under our de-dollarization theme). Separately, Standard Chartered Research noted that Asia bank USD subordinated-debt supply remains limited as banks rely on deep local markets or choose not to refinance due to comfortable capital buffers. This is supportive for selective bank capital instruments, particularly where call incentives and reset spreads remain attractive.
Overall, Asia credit remains a quality carry market. Spreads are tight, but fundamentals remain broadly stable and technicals are supported by limited supply in selected segments. We prefer staying selective in high-quality Asia IG, AI-linked credits with clear rating momentum such as SK Hynix, AUD credit for diversification, and bank capital where issuers have strong capital buffers and clear refinancing discipline.
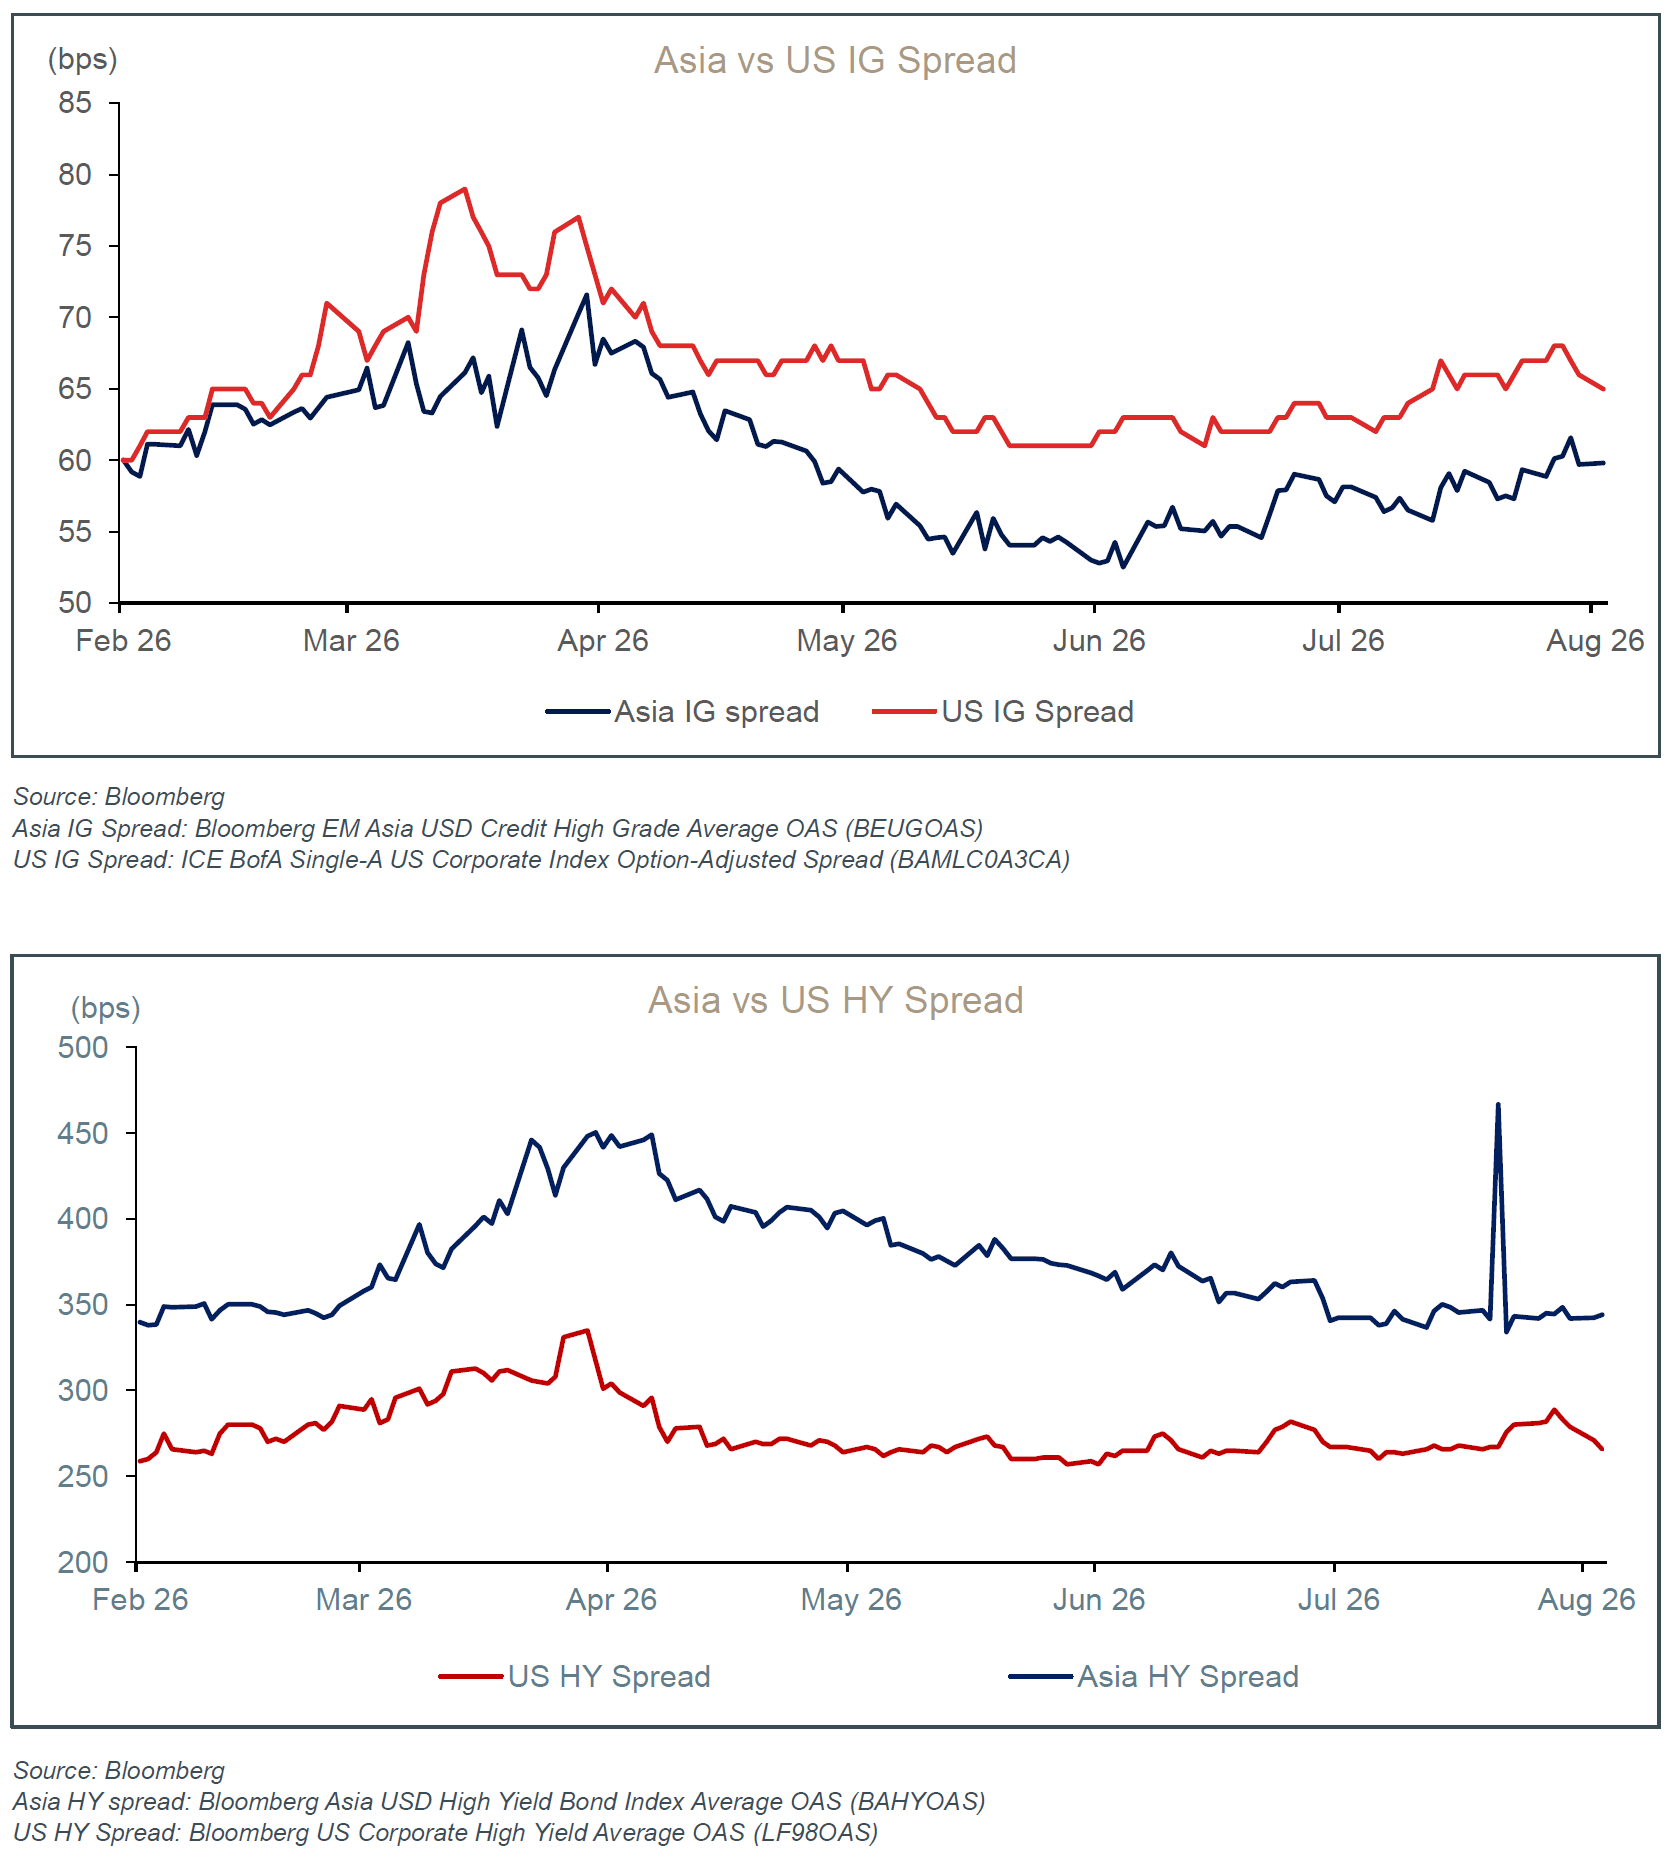
Credit Spreads
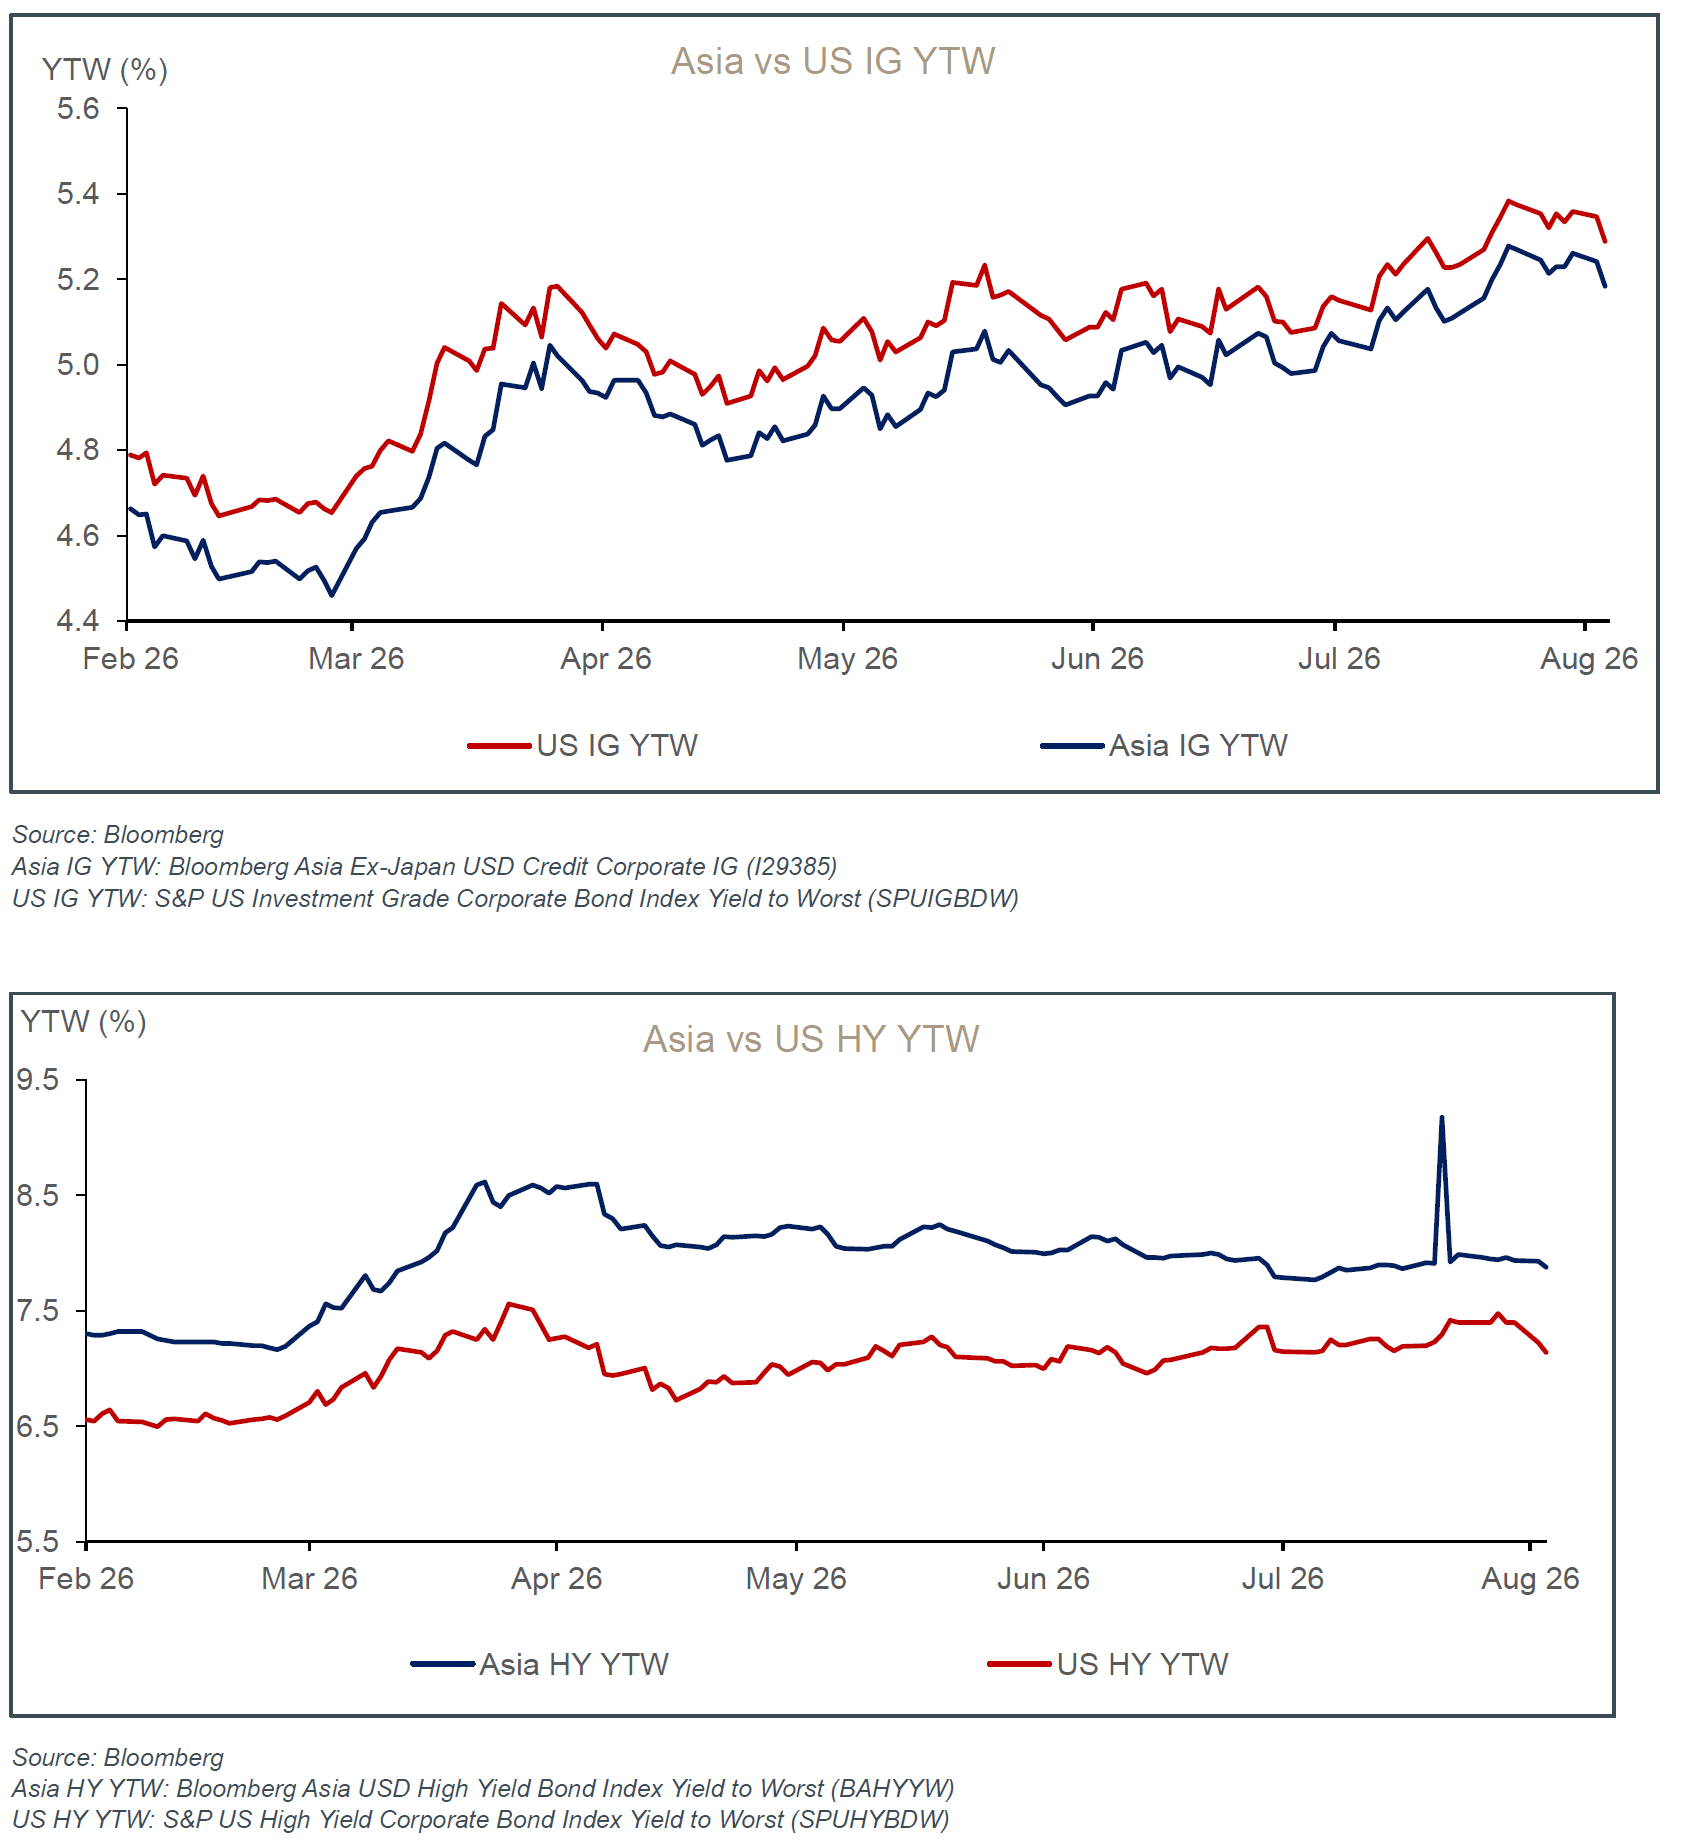
Credit Yields
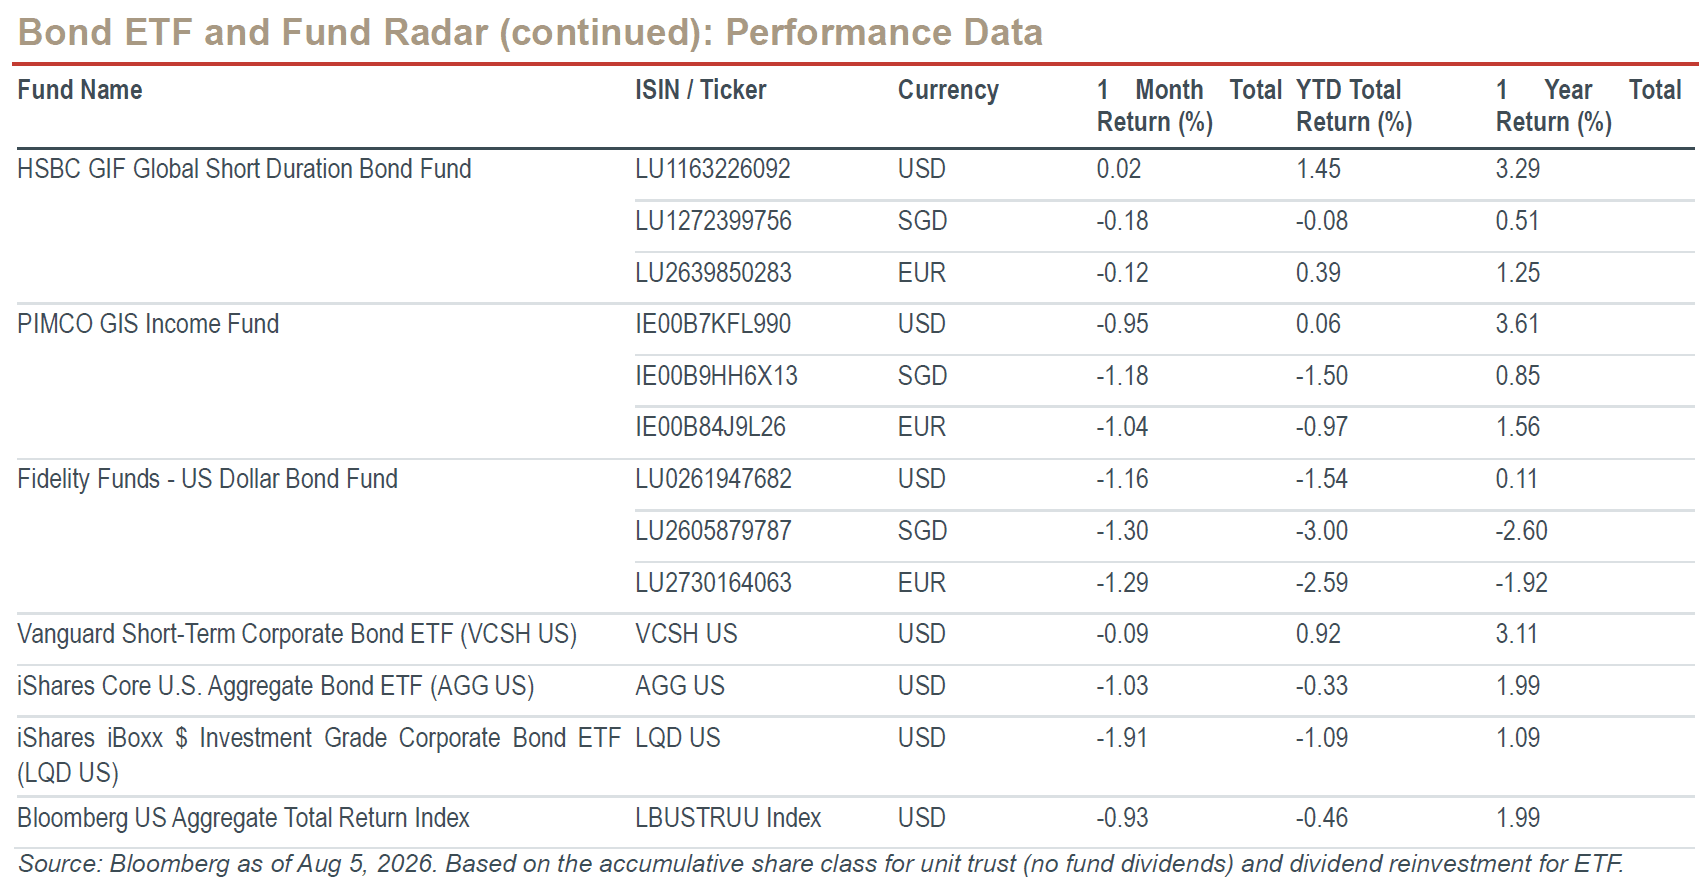
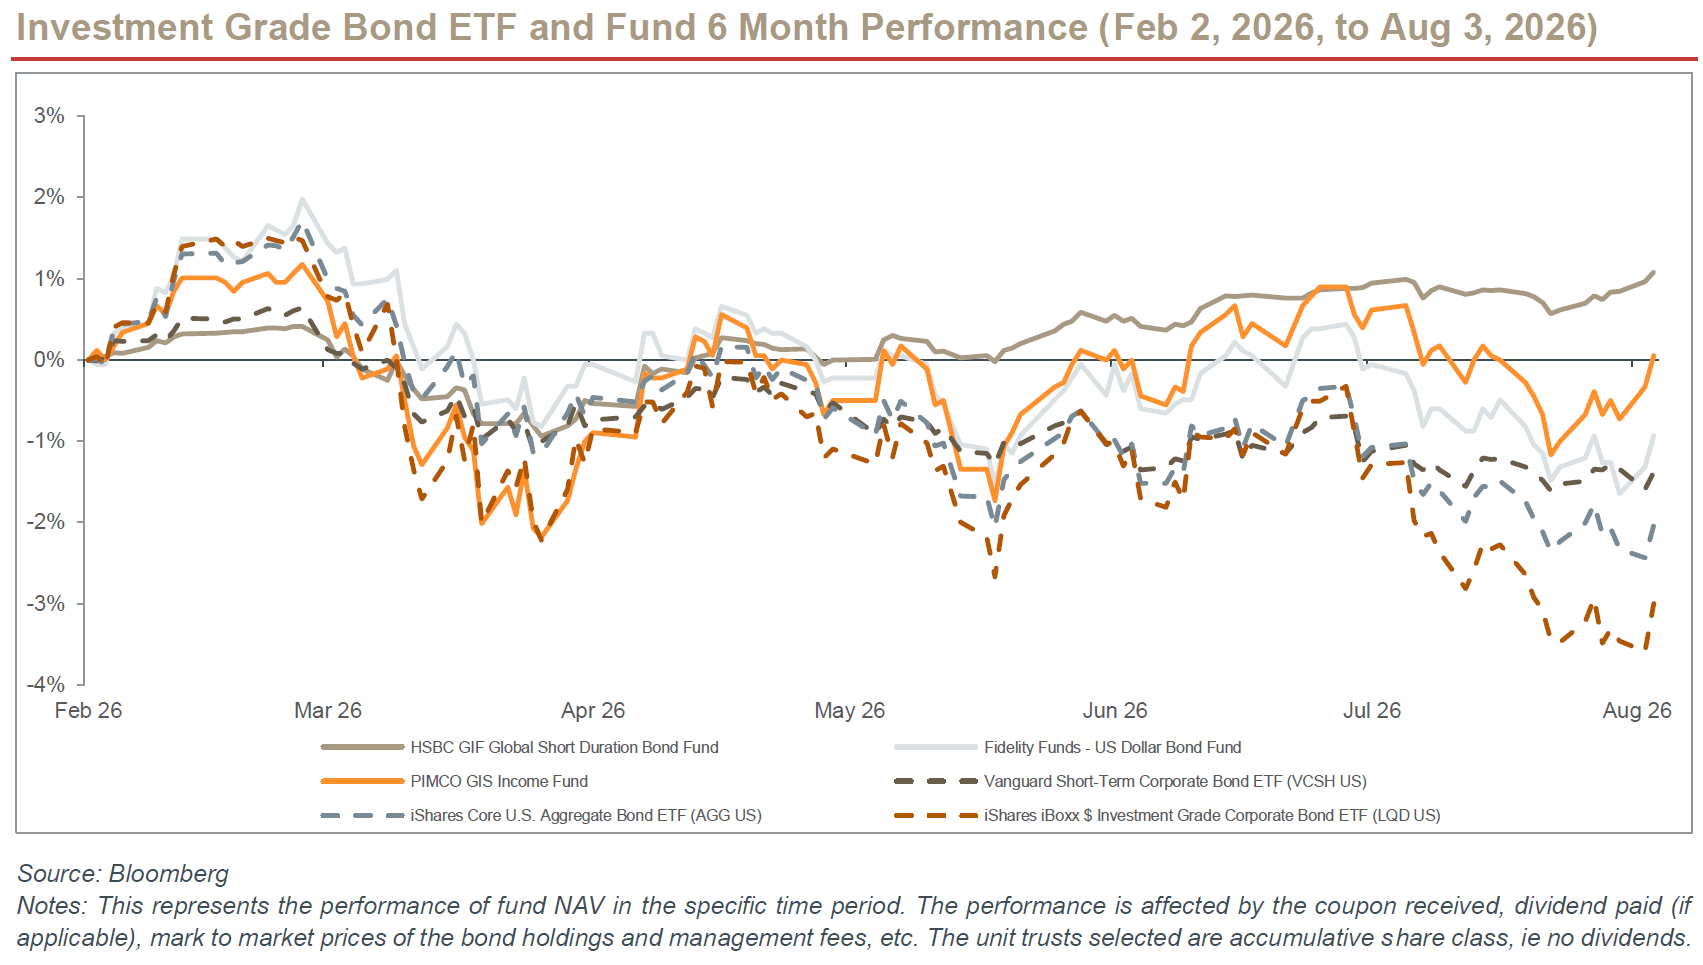
Bond ETF and Fund Radar
Key Risks for Investing in Bond Funds
- Market risk: Bond prices can fall due to rising interest rates, widening credit spreads, economic slowdowns, or issuer-specific issues.
- Currency risk: FX movements can significantly affect returns.
o Stronger USD boosts unhedged foreign holdings in SGD terms.
o Weaker USD can offset or even reverse bond gains.
- Hedged share classes: Many funds offer SGD, EUR, AUD, HKD, or CNH-hedged classes to reduce FX volatility and focus on credit and duration exposure.
High-Yield Exposure
- Global bond funds may hold both investment-grade and high-yield bonds.
- High-yield bonds carry higher default, macro, and liquidity risks.
- This means greater price volatility and potential capital losses, especially if the exposure is unhedged in a weakening currency.
Key Considerations
- Past performance is not indicative of future results.
- Yield alone should not drive investment decisions.
- If diversifying away from USD amid de-dollarisation trends, compare:
o Hedged share classes
o Hedging costs
o Overall risk–return profile
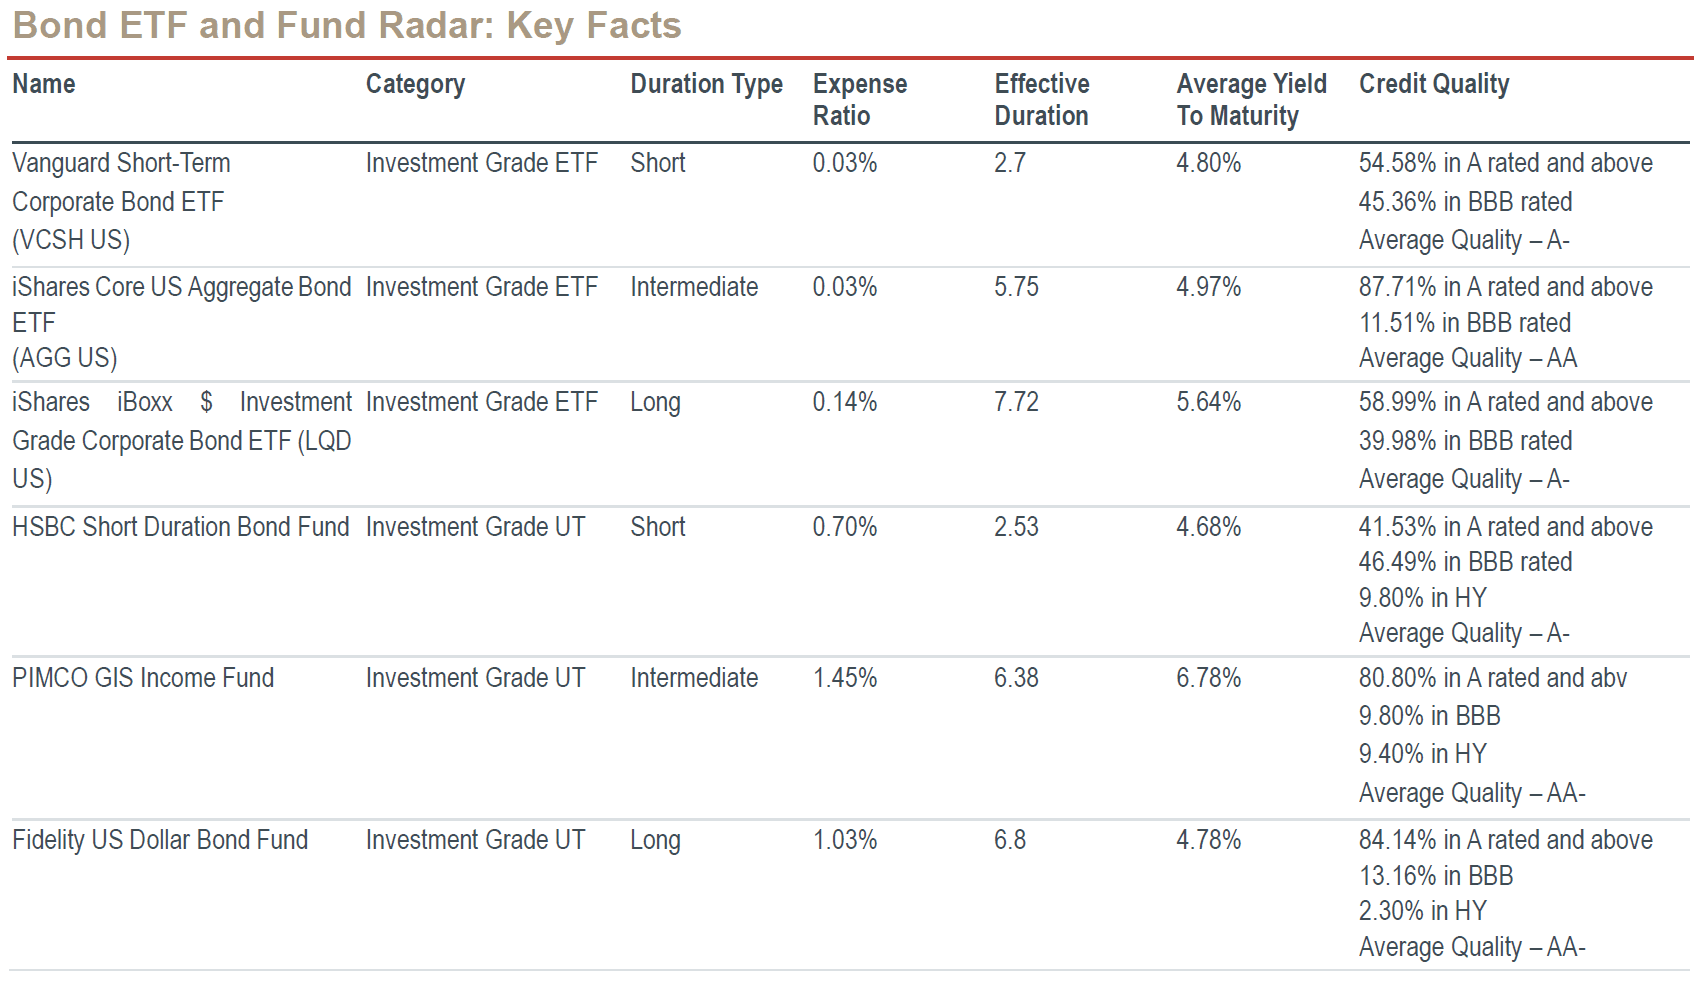
Source: Bloomberg, Morningstar, iShares and Vanguard as of Aug 5, 2026. US-listed ETFs might subject investors to a 30% withholding tax on all dividends received. Please consult your tax consultant for further information.
Glossary
Average Coupon: the weighted average of the various coupons of a bond portfolio.
Average Credit Quality: the weighted average of each bond’s credit rating in a portfolio. See Average Rating below.
Average Duration: the sensitivity of the value of a bond portfolio to interest rate changes. The longer the duration, the more sensitive toward interest rate changes.
Average Rating: the weighted average rating of all bonds in a portfolio. For example, a portfolio with 25% in AAA, 25% in BBB and 50% CCC bonds would have a weighted average credit rating of B+, which is between BBB and CCC.
Average Yield To Maturity: the rate of return required for the present value of all the future cash flows of a bond portfolio to equal the current bond price.
Yield To Worst (YTW): a measure of the lowest possible yield on a bond that fully operates within the terms of its contract without defaulting. It is based on the earliest call or retirement date, assuming that a prepayment of principal occurs if a bond issuer uses the call option.
Effective Duration: see Average Duration above.
Effective Maturity: the date used in place of the final maturity for bonds with call, put or prepayment features.
Running Yield: coupon divided by a bond portfolio’s market price. This is different from Yield to Maturity as the Running Yield does not take into account if the bond market price is below or above Maturity redemption value.
CIO Summary
- Short-term: everyone has a view, no one knows for sure. Fed Chair Kevin Warsh’s intentional ambiguity in rate decisions will keep markets guessing – and swinging sharply between our “false hawkishness” and “false dovishness”. Our own educated guess still points to a first rate hike in December, while acknowledging the extreme uncertainty ahead.
- Longer-term: beyond just rates. The real game-changer lies in Warsh’s structural reform agenda, signified by his recent launch of five task forces to overhaul the Fed policy framework. This could deliver tangible results as early as end-2026.
- AI’s broadening market impact. The narrative on AI’s impact on fixed income is rapidly evolving from corporate credit into a paradigm shift at the macro level. The AI Credit Supercycle is now exerting upward pressure on the entire yield curve.
- It may all work out in the end. We see an emerging risk of a self‑reinforcing vicious cycle, where heavy AI‑related debt issuance widens spreads, raises borrowing costs, and forces even more debt issuance. However, this risk could be mitigated by Fed Chair Warsh’s belief in AI’s positive macro potential – provided that AI ultimately delivers the impact that he expects.
- Core Recommendation: remains on high-quality, investment-grade (IG) bonds with short durations (< 3 years).
- Bond highlight: Singapore Airlines SIASP 3.5% 2 Dec 2030
Bond Radar
Below is a list of popular investment-grade (IG) bonds curated by our Products Team. These are for reference only and do not constitute our recommendations. For further details, please contact our fixed-income & credit specialist, Benjamin Tan Shun Chao at benjamintan@uobkh.com
We also offer regular updates on selected bonds from the Bond Radar above. The month’s Bond Highlight is on:
SIASP 3.5% 2 Dec 2030
About the Issuer
Singapore Airlines (SIASP, C6L), or SIA for short, is a leading carrier in Asia and globally, backed by the Singapore government and renowned for its premium service. It operates a fleet of 155 aircrafts, connecting over 130 cities across 60 countries. As of 4 August 2026, SIA has an equity market cap of SGD 23.96bn and cash on hand of SGD 8.51bn. The company has SGD4.02bn of bonds outstanding, with an average maturity of 3.97 years and an average fixed coupon of 3.45% (source: Bloomberg).
Investment Thesis
- Strong sales underscore resilient demand. 1Q2027 revenue rose 19.3% YoY, supported by higher passenger revenue and a 12.7% increase in passenger yield (revenue / kilometers).
- Weak earnings pressured by costs. Operating profit fell to SGD 106mn as fuel costs surged, while associate Air India remained a drag on group earnings.
- Quick recovery expected. UOBKH expects 2Q2027 earnings to rebound to SGD 240mn–SGD 460mn, underpinned by better fuel-cost pass-through and lower jet fuel prices quarter on quarter.
- Balance sheet remains a key credit strength. Despite a weak quarter, UOBKH estimates that SIA’s net cash position has improved to around SGD 3.3bn, supporting bond repayment capacity.
- Credit risks manageable. Elevated fuel prices, weaker travel demand and prolonged Air India losses remain key risks, but SIA’s strong liquidity and low leverage provide a meaningful buffer.
- Strategic shareholder support. Temasek’s 50.6% stake and SIA’s importance as Singapore’s flag carrier provide additional credit comfort, though the bond is not explicitly government guaranteed.
Financial Highlights (1Q2027)
- Operating cash flow to interest expense: 34.61x. Robust interest coverage and ample debt-servicing buffer.
- Free cash flow to total debt: 16.09%. Healthy internal cash generation relative to total borrowings.
- Net debt / EBITDA: 0.44x. Low leverage provides SIA with a strong buffer against higher fuel costs, weaker demand and other macro headwinds.
- Current ratio: 0.97x. Slightly below 1.0x but manageable given SIA’s sizeable cash balance, committed credit lines and normal airline working-capital profile.
- Return on invested capital (ROIC): 5.6%. Moderate returns reflect the capital-intensive nature of aviation and current pressure from fuel costs and associate losses.
- Altman Z-Score: 1.43. This appears weak on the surface, but it likely overstates the actual default risk given SIA’s strong credit metrics and implicit government backing.
Macro Comments
We track the following US economic data to understand the Fed policy and interest rate changes. We then selectively comment on a few of the indicators, those that we deem the most relevant.
Key conclusion: Fed Chair Kevin Warsh’s intentional ambiguity in rate decisions will keep markets guessing – and swinging sharply between our “false hawkishness” and “false dovishness”. Our own educated guess still points to a first rate hike in December, while acknowledging the extreme uncertainty ahead. Regardless, the real game changer lies in Warsh’s structural reform agenda for the Fed.
- Fed Policy (July FOMC). The latest FOMC held rates steady against hawkish market expectations. The Committee voted 9-3 to hold the target rate at 3.50-3.75% for the fifth consecutive time, signaling a further widening divergence within the Fed. Chair Warsh’s press conference sparked sharply divergent interpretations, reinforcing our view of his intentional ambiguity. The following illustrates why the market can often swing between our “false hawkishness” and “false dovishness”:
o False dovishness: Warsh refused to label the July decision as a "pause", and reiterated his commitment to the 2% inflation target ("not hesitate to act" when necessary).
o False hawkishness: Warsh recognized that the spontaneous surge in long-term treasury yields since mid-June has effectively "done much of the Fed's work” (effective tightening).
We maintain our view that Warsh is a reformist, and his primary focus is on long-term institutional overhaul rather than near-term rate calculus. Therefore, his five new task forces (inflation framework, communications, balance sheet, data sources and productivity) will be more important to watch. Tangible Fed reforms will likely be unveiled before the end of 2026.
- Inflation (June CPI, PCE and trimmed PCE). June data eased market concerns of reaccelerating inflation: core CPI came in flat, with YoY reading dropping to 2.6%. The cooling was broad-based, as energy prices trended down in June (as we noted in the last Fixed Income Monthly), combined with a renewed slowing in shelter inflation. June PCE also offered a downside surprise, with core PCE (Fed’s current preferred inflation measure) printed a mild 0.13% MoM increase. Notably, if we look at trimmed PCE, Kevin Warsh’s favorite gauge, the June reading was merely +2.2% over the last 12 months, down from 2.4% in May and moving closer to Fed’s 2% target.
- GDP (2Q2026 GDP). The advance print for 2Q2026 real GDP was merely 1.5% annualized, below market expectation of 2.0% growth. The underlying GDP composition reveals continuous resilience of the US economy, with consumption rising 3.2% (likely reflecting the World Cup boost) and equipment growth up 15.2% (likely due to the AI boom). A notable divergence is the income-expenditure dynamic: in 2Q2026, personal disposable income declined 0.38% QoQ, while personal consumption expenditures expanded 0.78% QoQ. It seems that a persistent drawdown of household buffers has pushed the personal savings rate down to 2.7%, raising questions about the sustainability of consumer-led growth into 2H2026.
- Production (July Manufacturing PMI). Corporate America’s industrial base continued to demonstrate resilience. The ISM Manufacturing PMI surged 2.3 index points to 55.6 in July, exceeding market expectations and marking its highest reading since May 2022. The underlying composition was broad-based, with meaningful expansions across new orders, production, and employment sub-indices, confirming a reacceleration in US factory activities.
Hot Topic: Widening AI Spreads Meet “Higher for Longer” Worries
Today, you can’t possibly analyze or discuss any investment topic without bringing AI into the discussion – fixed income included. The narrative surrounding AI’s impact on fixed income is rapidly evolving from corporate credit into a paradigm shift at the macro level.
- The AI-Fed Collision. Following our June discussion on the "4.5%+ Yields New Regime" and July’s introduction of the "AI Credit Supercycle," the latest market data points to a critical convergence: the sheer scale of AI-related debt issuance is colliding with a "higher for longer" rate environment, triggering a notable widening in AI credit spreads.
- What the CDS market tells us. As shown in the chart below, the cost of hedging against AI company credit risk is rising rapidly. The 5-year credit default swap (CDS) for AI bellwethers has widened significantly YTD, with Oracle’s 5-year spread trading above 200 bps as of July 2026. While the market remains positive on AI’s long-term earnings potential, it is still testing near-term cash flow resilience and digesting an unprecedented amount of new debt supply. According to Goldman Sachs, hyperscalers (Amazon, Microsoft, Alphabet, Meta, Oracle) are on track to issue roughly USD 250bn in 2026 (a ~2.5x increase) and ~USD 400bn in 2027 (4x pre-surge levels).
- The AI Credit Supercycle. Debt issuance by itself doesn’t mean distress, but the sheer size could lead to a broad, structural shift in market conditions. Historically, every major tech revolution—from canals and railways to electrification and telecommunications—was financed through debt and leverage. The current cycle may not be any different. However, such a concentrated influx of highly rated supply can quickly absorb market liquidity, crowding out other corporate issuers and increasing market fragility. In the USD IG market alone, AI-related supply has generated a record 23% of total gross issuance. Consequently, the structural supply headwind is exerting upward pressure on the entire yield curve and compressing the spread cushion.
- Short-term risk of a self-reinforcing vicious cycle. The above dynamic has the structural setup to become a negative feedback loop, driven by a concentrated debt supply shock. Namely, a massive AI-related debt issuance could continue to widen spreads, raise borrowing costs and force companies to issue even more debt. Both J.P. Morgan and Goldman Sachs have alluded to this (see the US Credit section below).
- Long-term relief from Fed policy flexibility. Kevin Warsh has been a vocal supporter of AI’s positive macro potential, making him the first Fed Chair after Alan Greenspan to formally integrate technology‑driven productivity gains into the central bank’s policy framework. Warsh believes that AI can structurally raise the economic growth potential while easing inflation pressures, giving the Fed greater flexibility in guide policy toward its estimated neutral rate. This should mitigate the risk of a supply-driven negative feedback loop triggered by AI credit. The critical assumption here is that AI ultimately delivers the impact that Warsh envisions.
Credit View
US Credit: Stay Disciplined, Stay Short
US IG credit remains broadly supported by attractive all-in yields, but the market is becoming more selective as rate volatility and AI-related supply weigh on spreads. In the current environment, we expect US IG spreads to remain range-bound, with income carry remaining the main driver of returns rather than aggressive spread compression.
- J.P. Morgan calls the hyperscaler repricing moment. The firm noted that long-end yields are at the highest level since Nov 2023, which should attract yield seekers, although the support is less certain this time as the market is expecting two rate hikes through mid-2027 and geopolitical risks remain unresolved. As noted above, the key theme remains repricing of hyperscalers and other AI-related issuers, which J.P. Morgan described as a "tale of two markets" in IG – with hyperscalers widening significantly more than the rest of the index. July was also the second-highest month ever for its gross technology supply of USD 49bn, representing a record 34% of total monthly issuance. This further explains why technical pressure becomes the key spread driver.
- Goldman Sachs highlighting the sheer scale of AI funding. The firm estimates USD 489bn of AI-related debt issuance so far this year, already above its full-year 2025 estimate of USD 322bn. Importantly, only around 40% of this was directly issued by the hyperscalers, with the rest from independent data centres, semiconductors, software, equipment and other parts of the AI ecosystem. AI-related issuance now accounts for 23% of USD IG gross supply and 20% of USD HY gross supply. This is no longer just a Big Tech story; it now carries broader market implications.
- Rising rating agency scrutiny. There has not been a broad downgrade cycle for the US hyperscalers, but rating agencies are increasingly concerned about AI-related balance sheet pressures. A Moody’s-related article flagged that unprecedented AI capex is eroding free cash flows and increasing financial risks for hyperscalers such as Amazon, Meta, Alphabet and Microsoft – even though these issuers still maintain some of the strongest balance sheets globally. In addition, data center lease obligations could become a growing focus for rating agencies over time. Goldman Sachs estimates that hyperscaler lease obligations total roughly USD 1.2tn, including USD 725bn of leases not yet commenced.
Our emphasis on emerging credit risk does not imply a bearish stance. We remain constructive on US IG credit, while advocating a more disciplined approach. We hereby reiterate our Core Recommendation on high-quality, investment-grade bonds with short durations (< 3 years).
Asia Credit: Quality Carry Amid AI Repricing
Asia credit remains resilient despite higher global rates and tighter spread valuations.
- J.P. Morgan views rate volatility as a key risk. The firm noted that the Asia credit market gained modestly in the final week of July, bringing YTD return to around 0.4%. Spreads tightened 1 bp to 88 bps and remained within a narrow July range of 83–94 bps. The key risk is no longer credit fundamentals, but rate volatility, especially if confidence in the Fed weakens and long-end Treasury yields stay elevated.
- Bloomberg zeroes in on the Asian AI theme. The AI theme is increasingly relevant for Asia credit, but with a slightly different angle from the US. Bloomberg Intelligence noted that both SK Hynix and TSMC bonds have slightly underperformed the Bloomberg Asia USD Credit Total Return Index YTD. Their record AI-driven revenues raise concerns over sustainability of their customers’ spending. However, credit quality remains supported by their robust earnings and strong balance sheets, with both issuers retaining high-grade strength.
- Moody’s upgrades SK Hynix. The rating agency recently upgraded of Hynix and its senior unsecured ratings from Baa1 to A3, with a stable outlook. Moody’s noted that the change reflects positive expectations for Hynix’s profitability and cash flow generation over the next 12–18 months, which will likely strengthen its balance sheet and provide a meaningful buffer against the next memory industry downcycle (if any).
- Singapore bank credit remains one of the most defensive areas in Asia, supported by sound asset quality, strong capital buffers and easing commercial real estate risks. Bloomberg Intelligence noted that Singapore banks’ CRE loan risks should ease further in 2H, as most weak CRE loans had already been recognized as impaired in previous years. Hong Kong property conditions are also showing signs of stabilization. DBS’s real estate exposure remains mostly high-quality, while OCBC and UOB continue to benefit from prudent lending standards and low loan-to-value ratios. These factors combined continue to support the resilience of Singapore bank USD bonds, although spread tightening may be limited as strong credit profiles and low bond volatility are already priced in.
- We also continue to see value in AUD credit and Asia bank capital as diversification tools. Bloomberg Intelligence highlighted that the Ausbond Credit Index has an average A1 rating, around two notches higher than Asia ex-Japan USD credit high grade and US IG peers, while offering shorter duration and comparable or higher spreads. This supports the case for AUD credit as a way to diversify away from USD exposure (under our de-dollarization theme). Separately, Standard Chartered Research noted that Asia bank USD subordinated-debt supply remains limited as banks rely on deep local markets or choose not to refinance due to comfortable capital buffers. This is supportive for selective bank capital instruments, particularly where call incentives and reset spreads remain attractive.
Overall, Asia credit remains a quality carry market. Spreads are tight, but fundamentals remain broadly stable and technicals are supported by limited supply in selected segments. We prefer staying selective in high-quality Asia IG, AI-linked credits with clear rating momentum such as SK Hynix, AUD credit for diversification, and bank capital where issuers have strong capital buffers and clear refinancing discipline.
Credit Spreads
Credit Yields
Bond ETF and Fund Radar
Key Risks for Investing in Bond Funds
- Market risk: Bond prices can fall due to rising interest rates, widening credit spreads, economic slowdowns, or issuer-specific issues.
- Currency risk: FX movements can significantly affect returns.
o Stronger USD boosts unhedged foreign holdings in SGD terms.
o Weaker USD can offset or even reverse bond gains.
- Hedged share classes: Many funds offer SGD, EUR, AUD, HKD, or CNH-hedged classes to reduce FX volatility and focus on credit and duration exposure.
High-Yield Exposure
- Global bond funds may hold both investment-grade and high-yield bonds.
- High-yield bonds carry higher default, macro, and liquidity risks.
- This means greater price volatility and potential capital losses, especially if the exposure is unhedged in a weakening currency.
Key Considerations
- Past performance is not indicative of future results.
- Yield alone should not drive investment decisions.
- If diversifying away from USD amid de-dollarisation trends, compare:
o Hedged share classes
o Hedging costs
o Overall risk–return profile
Source: Bloomberg, Morningstar, iShares and Vanguard as of Aug 5, 2026. US-listed ETFs might subject investors to a 30% withholding tax on all dividends received. Please consult your tax consultant for further information.
Glossary
Average Coupon: the weighted average of the various coupons of a bond portfolio.
Average Credit Quality: the weighted average of each bond’s credit rating in a portfolio. See Average Rating below.
Average Duration: the sensitivity of the value of a bond portfolio to interest rate changes. The longer the duration, the more sensitive toward interest rate changes.
Average Rating: the weighted average rating of all bonds in a portfolio. For example, a portfolio with 25% in AAA, 25% in BBB and 50% CCC bonds would have a weighted average credit rating of B+, which is between BBB and CCC.
Average Yield To Maturity: the rate of return required for the present value of all the future cash flows of a bond portfolio to equal the current bond price.
Yield To Worst (YTW): a measure of the lowest possible yield on a bond that fully operates within the terms of its contract without defaulting. It is based on the earliest call or retirement date, assuming that a prepayment of principal occurs if a bond issuer uses the call option.
Effective Duration: see Average Duration above.
Effective Maturity: the date used in place of the final maturity for bonds with call, put or prepayment features.
Running Yield: coupon divided by a bond portfolio’s market price. This is different from Yield to Maturity as the Running Yield does not take into account if the bond market price is below or above Maturity redemption value.
Disclosures and disclaimers
This report is provided subject to, and must be read together with, the full Disclosures / Disclaimers available at this link, which are incorporated by reference into this report. In particular, this report is intended for general circulation and informational purposes only and does not constitute personal investment advice or a recommendation to buy or sell any investment product or security. You should independently evaluate the information and, where necessary, seek advice from a qualified financial adviser regarding the suitability of any investment. Analyst certifications required under applicable regulations, including SEC Regulation AC (where relevant), are included in this report. By accessing, receiving or using this report, you acknowledge that you have read, understood and agreed to be bound by the Disclosures / Disclaimers, as may be amended, supplemented or updated from time to time.


