

CIO Summary
Concentration everywhere. US equity performance remains highly dependent on Big Tech and AI, while 3Q earnings growth is similarly concentrated, putting the spotlight firmly on AI-related earnings and raising the stakes for AI leaders to deliver.
Sep-Oct market awakening intact. Macro headwinds add to the pressure on AI companies to perform, in order to sustain today’s narrow market leadership. We continue to believe a macro-driven, market awakening is in the works, although historically stocks tend to rally following the mid-term elections (November 3, 2026).
Meanwhile, the Fed Wildcard remains very much alive, with long-term yields turning “higher-for-longer” and adding pressure to rate-sensitive parts of the market. In China, persistent “Growing Pains” continue to weigh on the broader economy and equities despite strength in AI and exports. Against this increasingly uneven backdrop, we remain selective, favouring our Barbell Strategy of AI, defensives and energy, alongside short-duration, high-quality bonds.
Our All ETF Model Portfolio for global asset allocation lost 1.3% in September yet still gained 5.3% YTD. The Semiconductor Sector ETF (SOXX) and Nasdaq-100 (QQQ) were the largest contributors, while Industrials (XLI) and the CSI 300 ETF (3188.HK) were the biggest detractors.
Our US Stock Model Portfolio gained 1.3% in September and returned 10.2% YTD. Top 3 performers: META +26.8%, SKHY +11.9% and MU +11.1%.
Our China Stock Model Portfolio dropped 4.8% in September and lost 8.4% YTD. Top 3 performers: 2899.HK +10.2%, 883.HK +6.2% and 3986.HK +5.9%.
Fixed income: The Fed Wildcard is very much live, while long-term yields are turning “higher-for-longer”. Maintain our Core Recommendation on short-duration, high-quality corporate bonds.
Core Views and Recommendations
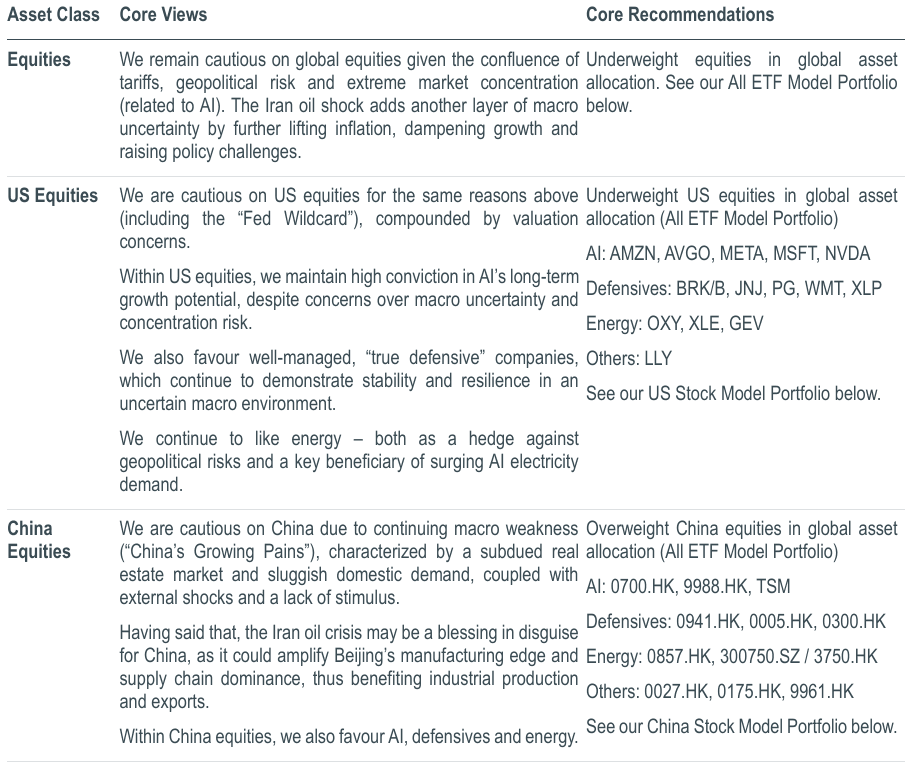
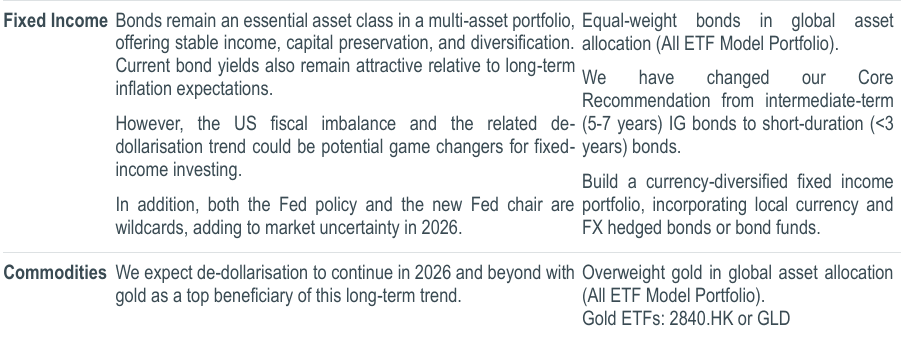
CIO Commentary
Our CIO Quarterly Review has been consistently one of our most-read reports, providing accountability for our core views and recommendations on a regular basis. Below are the key takeaways. Click here to read the full report.
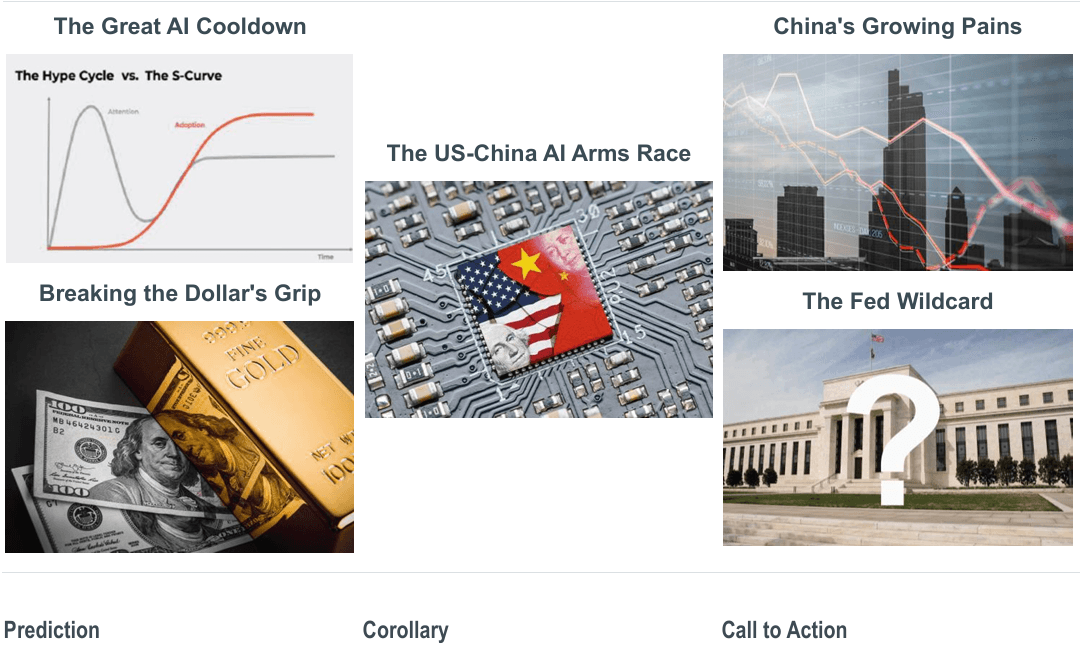
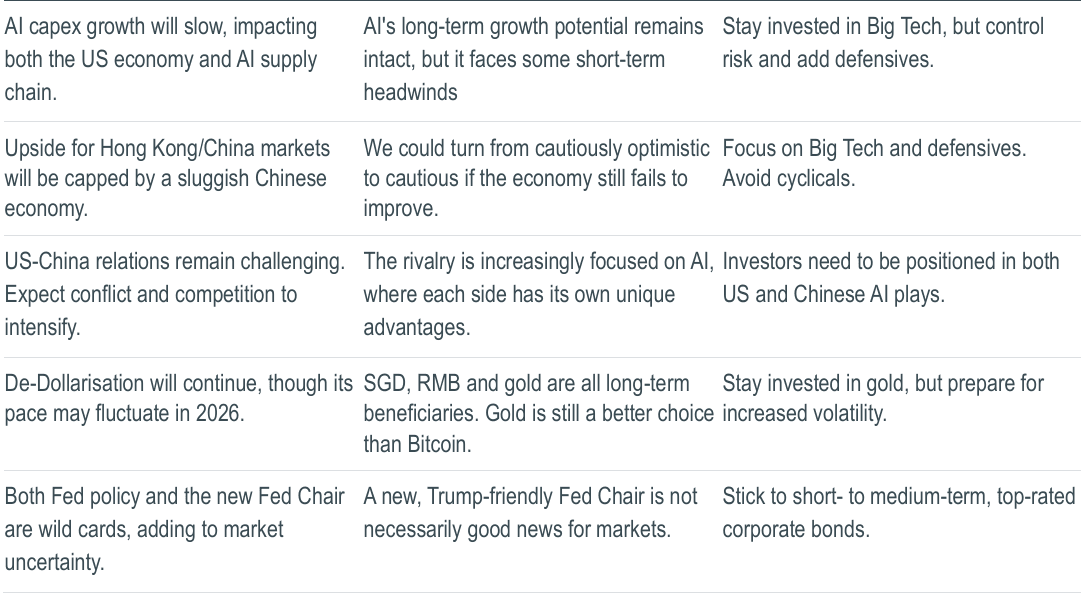
Four of our top five predictions were validated through 3Q. China’s Growing Pains, the US China AI Race, Breaking the Dollar’s Grip (de-dollarization), and the Fed Wildcard were all reinforced by data and evidence in 3Q. The one miss was the Great AI Cooldown, as AI capex remained surprisingly strong in 2026.
Macro shocks vs. AI tailwinds. Our Core Views were broadly well-placed in 3Q, although we underestimated the resilience of global and US equities as robust earnings and continued AI optimism outweighed macro headwinds. Our fixed-income view proved correct, with the Fed Wildcard and higher-for-longer long-term Treasury yields supporting our Core Recommendation for high-quality, short-duration bonds. Meanwhile, gold’s resilience further validated our long-term bullish view, underpinned by its role as a top de-dollarization beneficiary and a key portfolio diversifier.
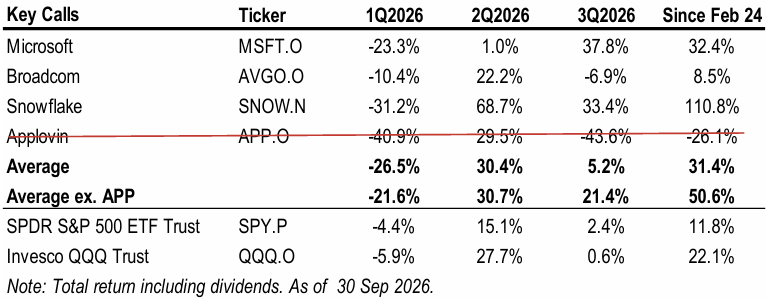
Key Call on oversold AI “casualties” continued to pay off, outperforming the Nasdaq 100 in 3Q and since our Feb 24 initiation. Microsoft, Broadcom and Snowflake remain our top picks here, backed by strong AI growth and adoption. AppLovin was removed after its August results raised company-specific concerns, but it remained on our watch list.
US Core Recommendations have broadly outperformed market in 3Q. Our AI stock picks outperformed both the S&P 500 and Nasdaq 100, while energy-related picks continued to beat the index by a wide margin. Defensives lagged during the market upturn, as expected, but remain essential portfolio stabilisers.
China Core Recommendations delivered mixed yet solid performance in 3Q. Our Greater China AI picks significantly outperformed the Hang Seng Tech Index, while energy-related stocks also maintained their YTD lead over the Hang Seng Index despite a weaker 3Q. Defensives lagged during the market rebound but remained ahead YTD. Almost everywhere, China’s Growing Pains continued to weigh on company fundamentals and investor sentiment.
We continue to recommend a balanced approach based on our barbell strategy, investing across AI, defensives and energy.
Asset Allocation (All ETF Model Portfolio)
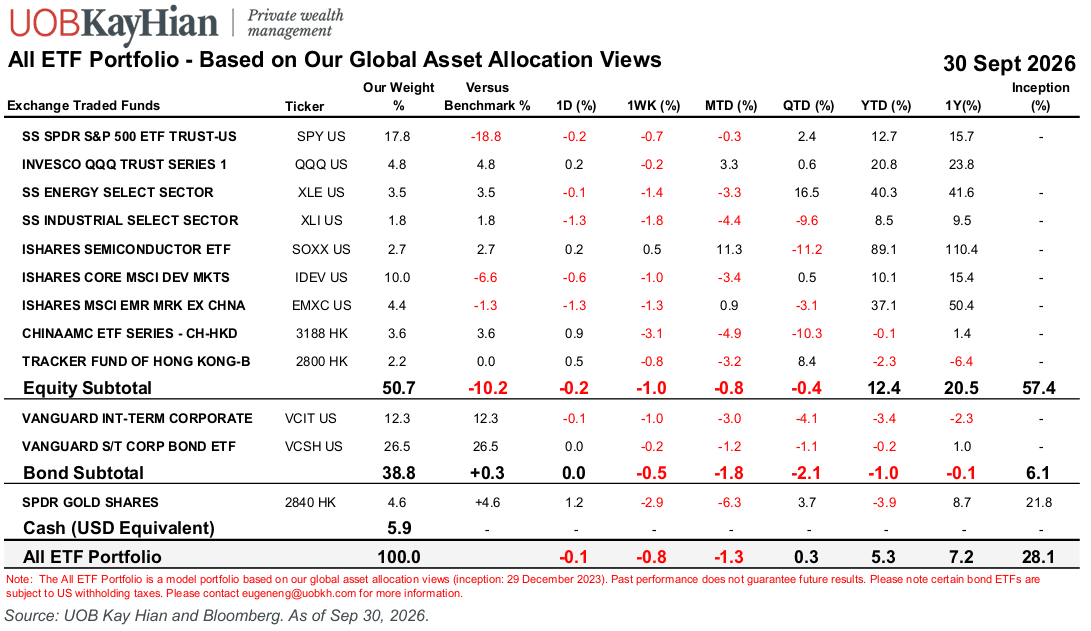
- Our All ETF Portfolio for global asset allocation was down 1.3% in September yet still up 5.3% YTD. The Semiconductor Sector ETF (SOXX) and Nasdaq-100 (QQQ) were the top performers, +11.3% and +3.3%, respectively. Meanwhile, Industrials (XLI) and the CSI 300 ETF (3188.HK) were the biggest detractors, -4.4% and -4.9%, respectively.
- US Equities UNDERWEIGHT (30.5% vs. 36.6%). In September, we took profits in the Semiconductor Sector ETF (SOXX) following its strong rebound while redeploying the proceeds into S&P 500 (SPY) for broader market exposure.
- Developed Markets ex-US UNDERWEIGHT (10% vs. 16.6%). DM ex-US (IDEV) dropped 3.4% in September, driven mainly by weakness in Europe amid rising bond yields, sticky inflation and emerging sovereign risk (e.g. France). The decline was partly offset by gains in Japan. IDEV remained up 10.1% YTD.
- Emerging Markets ex-China UNDERWEIGHT (4.3% vs. 5.6%). EM ex-China (EMXC) rose slightly by 0.9% in September, supported by gains in Taiwan and South Korea. Despite global macro pressures, strong AI supply chain fundamentals helped EMXC gain 37.1% YTD, making it one of the best performing regions globally. (Top constituents: TSMC 20%, Samsung 8%, Hynix 6%).
- China Equities OVERWEIGHT (5.8% vs. 2.2%). We reduced our position in the Hang Seng Index ETF (2800.HK) last month amid continued “growing pains” in China and rising US interest rates. We do not expect an immediate recovery in either the Chinese economy or stock markets.
- Fixed Income EQUAL-WEIGHT (38.8% vs. 39.0%). Our bond ETFs declined 1.8% in September as 10-year Treasury yields surged past 5% to multi-decade highs. The Intermediate-term Corporate Bond ETF (VCIT) fell 3.0% last month and lost 3.4% YTD, while the Short-term Corporate Bond ETF (VCSH) declined 1.2% in September yet gained 0.2% YTD. This performance disparity further validates our Core Recommendation to stay short-duration in today’s uncertain rate environment (see the Fixed Income section below).
- Gold OVERWEIGHT (4.6% vs. 0.0%). Gold (2840.HK) declined 6.3% in September, following a near 10% rally in August. Despite high volatility YTD, we continue to view gold as a valuable long-term hedge against geopolitical risks, currency volatility and de-dollarisation.
Equities
US Equities
Is our Sep-Oct market awakening happening? Perhaps not at the index level, but September was not an easy month for most US stocks. The index’s modest decline masked high concentration risk beneath the surface, with an equally concentrated 3Q earnings season now upon us. With the US mid term elections less than three weeks away, political uncertainty could add another layer of short-term volatility. The VIX has quietly climbed back above 17 as of mid-October, suggesting investor fear is building. We continue to believe a macro-driven market awakening is in the works, although historically stocks tend to rally after the mid-terms (November 3, 2026).
The Fed Wildcard on full display. Our top prediction for 2026 hit squarely, as the Fed raised rates by 25bps in September – its first hike in over three years. The FOMC’s unanimous 12–0 vote in favor of tightening underscores a clear determination to restore Fed credibility amid persistent inflation.
Higher long-term rates also begin to bite. The melt-up in global bond yields has helped push 10 year Treasury yields above 5.3% in early October, reflecting sticky inflation, resilient growth, a more hawkish Fed outlook and the mounting US debt burden etc. Higher long-term yields pose a material risk to rate-sensitive, cyclical sectors (e.g. real estate and mining) and financially fragile small caps (around 40% of Russell 2000 are unprofitable), as the rising cost of capital weighs heavily on their borrowing costs and valuation multiples.
Equities surprisingly calm. However, the stock market’s response has been relatively measured: the S&P 500 was down only slightly for the month and tentatively broke above the ~7700 congestion zone, pushing its YTD return to 13.1% by the end of September.
Extreme market concentration. While the headline S&P 500 sits close to all-time highs, the median S&P stock trades at 16% below its respective peak. This stark divergence has pushed market breadth to its lowest level since the Dot-Com Bubble. On one hand, US Big Tech and AI stocks continue to power ahead like a freight train. On the other hand, nearly half of the index names have exhibited negative beta to the index. Such concentration risk leaves the market increasingly vulnerable to a sudden change in sentiment.
Extreme earnings concentration. The 3Q earnings season kicks off this week, with roughly two thirds of S&P 500 companies reporting by October-end. Good news: consensus expects nearly 30% earnings growth for S&P 500 in 3Q, marking the third consecutive quarter of growth above 25%. Not so good news: Two companies, Nvidia and Micron, are expected to drive 36% of S&P earnings growth in 3Q (source: Citadel). In other words, the market’s extreme concentration (see above) is mirrored in earnings and can be justified by fundamentals. However, this has certainly raised the stakes for AI to deliver.
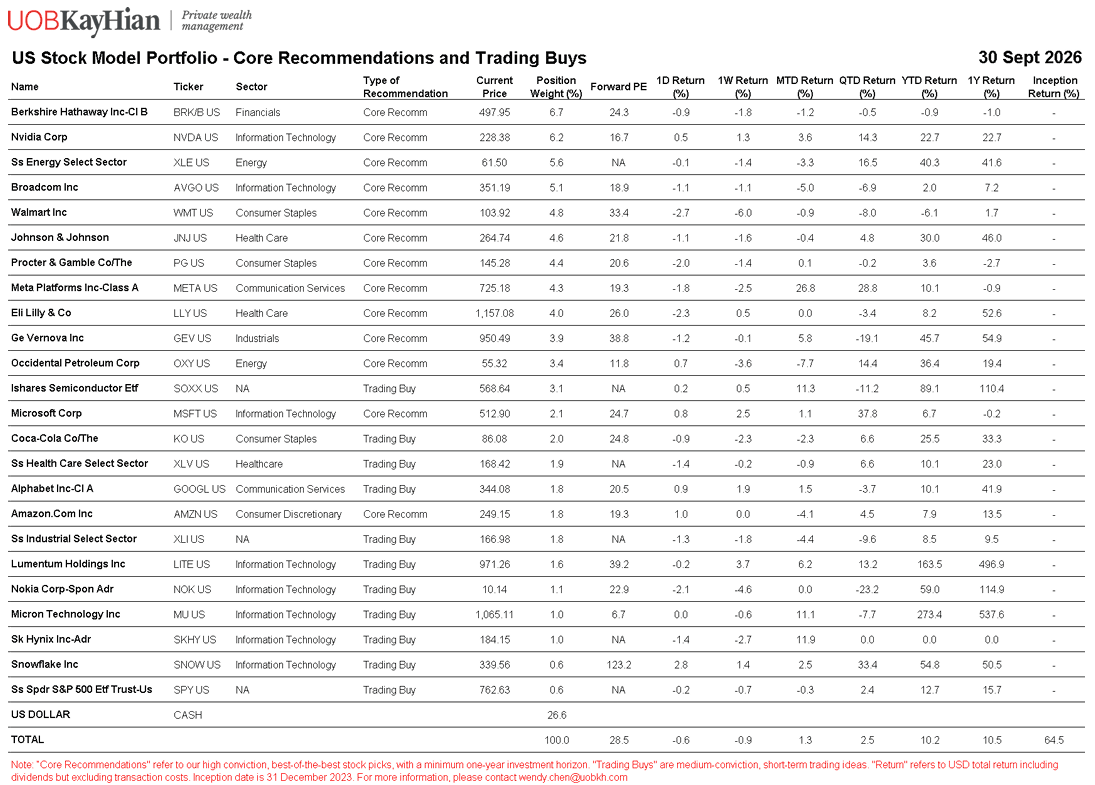
Source: UOB Kay Hian and Bloomberg. As of September 30, 2026.
Our US Stock Model Portfolio gained 1.3% in September and returned 10.2% YTD, outperforming S&P 500 (SPY) last month yet still underperforming the index YTD. The September alpha was driven by Information Technology (SKHY +11.9%, MU +11.1%, LITE +6.2%, NVDA +3.6%, SNOW +2.5%, GOOGL +1.5%, MSFT +1.1%) and Communication Services (META +26.8%). This was partly offset by losses in Energy (OXY -7.7%, XLE -3.3%), Consumer Discretionary (AMZN 4.1%), Health Care (JNJ -0.4%, XLV -0.9%), Consumer Staples (WMT -0.9%), and Industrials (XLI -4.4%).
Cash rose to 26.6% at September-end, as we sold stocks to prepare for the Sep-Oct market awakening.
Top 3 performers: META +26.8%, SKHY +11.9% and MU +11.1%.
Bottom 3 performers: OXY -7.7%, AVGO -5.0% and XLI -4.4%.
For company updates, please refer to our latest CIO Quarterly Review.
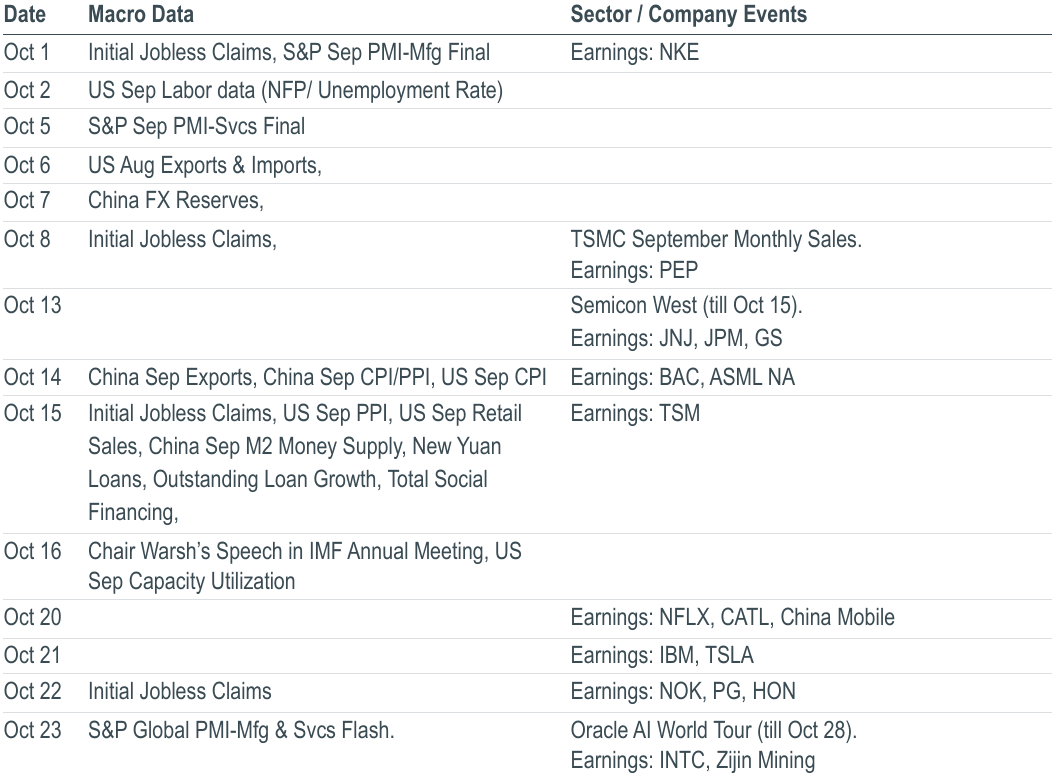
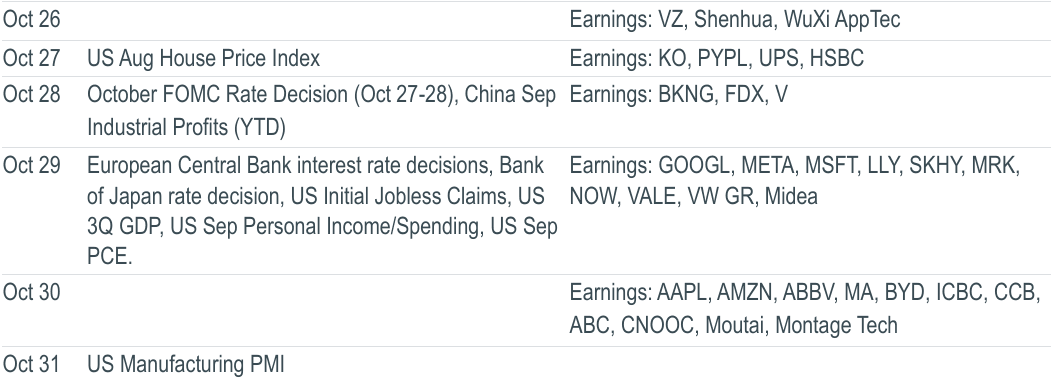
Must watch events for the rest of October: US Sep PPI and Retail Sales (Oct 15), Chair Warsh’s Speech at the IMF Annual Meeting (Oct 16), October FOMC Rate Decision (Oct 27–28), and US 3Q GDP and PCE (Oct 29). Earnings: ASML (Oct 14), TSMC (Oct 15), NFLX (Oct 20), TSLA (Oct 21), KO (Oct 27), GOOGL, META, MSFT, and SKHY (Oct 29), and AAPL and AMZN (Oct 30). For more information, please see Appendix B.
China Equities
September was a difficult month for Hong Kong-China equities. The Hang Seng Index fell 3.7%, while the CSI 300 declined 5.8%, weighted down by weak domestic fundamentals, limited policy stimulus and rising US interest rates.
China’s Growing Pains remain intact and unresolved. August industrial production rose 5.2% yoy, ahead of consensus, but retail sales increased just 0.4%. Jan-Aug fixed-asset investment fell 7.2%, including a 19.9% decline in property investment, while household loans contracted for a second consecutive month. September property data remained weak, with sales among the top 100 developers falling 9.2% yoy.
Exports remain a notable bright spot. September exports surged 36.3% yoy, well above consensus, led by semiconductors (+136%) and autos (+62%). This highlights the growing divergence between China's globally competitive export sectors and struggling domestic demand. The data also reinforce our China Export Shock 2.0 theme, which has profound implications for both the Chinese economy and global manufacturing industries.
Hong Kong faces an additional headwind from rising US interest rates. The Fed's renewed tightening and rising long-term Treasury yields have added economic and financial pressures on Hong Kong, given HKD's peg to the USD. This was evident during September, when Hong Kong underperformed mainland A-shares and the Hang Seng Tech Index came under renewed pressure.
We remain cautious on China, as we do not expect an immediate recovery in either the Chinese economy or equity markets. A broad-based market recovery will likely require clearer evidence of improving property sales, consumption and investment, rather than just a booming AI sector or simply more policy announcements. Key upcoming catalysts include China's 3Q GDP and September activity data on Oct 19, the LPR announcement on Oct 20, and Top 100 property sales on Oct 31.
Selectivity is key. A sluggish market (beta) is not necessarily bad for stock picking (alpha). In fact, cyclical weakness, uneven fundamentals and low valuations (expectations) can create attractive entry points in high-quality companies whose long-term investment theses remain intact. September's sell-off has further weakened investor sentiment, but it does not change our high conviction in our Chinese Core Recommendations.
Where we see opportunities. Regardless of the macro environment, we continue to focus on our Barbell Strategy consisting of AI, defensives and energy (applicable to both the US and China). In AI, we like full-stack leaders such as Tencent and Alibaba, where strong cash-generating core businesses support long-term AI investment and monetisation. Meanwhile, we also favour defensives for their earnings stability and compelling dividend yields, including PetroChina which also offers oil price exposure.
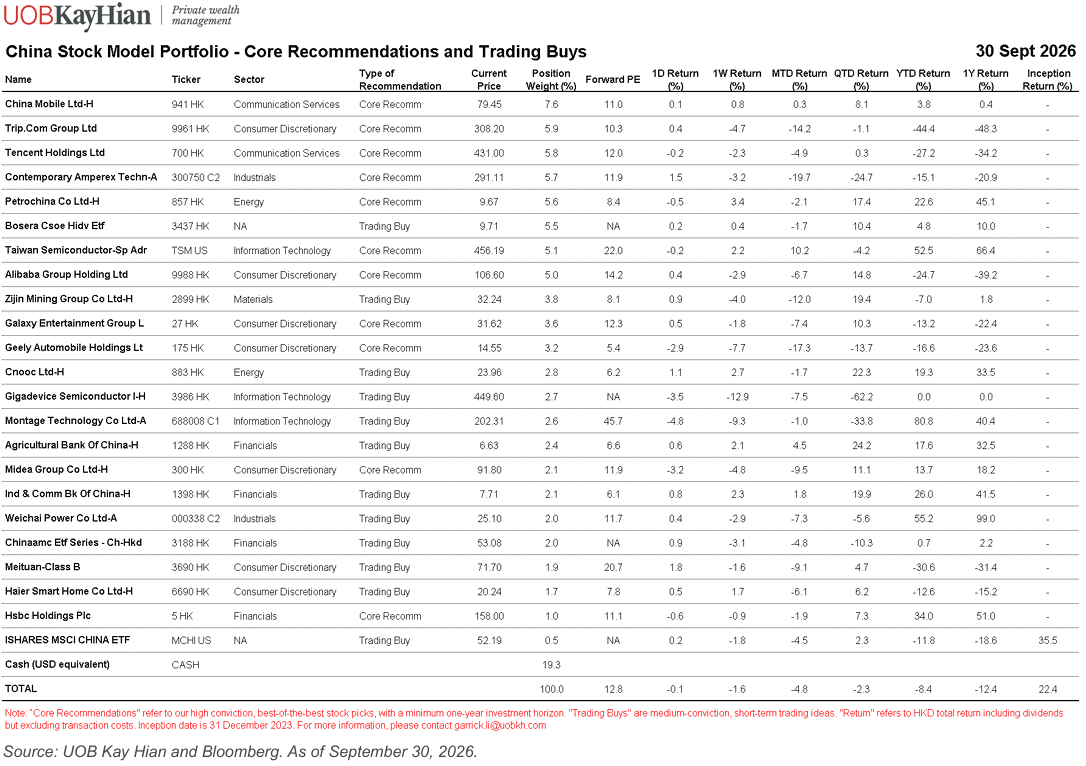
Our China Stock Model Portfolio dropped 4.8% in September, slightly underperforming the MSCI China ETF (MCHI -4.5%). The portfolio was down 8.4% YTD, still significantly outperforming MCHI’s 11.8% decline.
Cash slightly increased to 19.3% at month-end, compared with 18.3% in August.
Top 3 performers: TSM +10.2%, 1288.HK +4.5% and 1398.HK +1.8%.
Bottom 3 performers: 300750.SZ -19.7%, 175.HK -17.3% and 9961.HK -14.2%.
For company updates, please refer to our latest CIO Quarterly Review.
Must-watch events for the rest of October include China's 3Q GDP, September retail sales, industrial production, fixed-asset investment and unemployment – all on Oct 19; Loan Prime Rate (LPR) announcement on Oct 20; the Fifth Plenum in Oct 26-29; September industrial profits in late October; October NBS PMI and Top 100 property developer sales on Oct 31. Earnings: CATL (Oct 20) and HSBC (Oct 27).
Fixed Income
Below is the CIO Summary from our latest Fixed Income Monthly (12 Oct 2026), for Professional / Accredited Investors only. Ping benjamintan@uobkh.com if you’d like to receive the full report.
Fed Wildcard in full play. September’s sharp repricing of Fed expectations reinforces our Fed Wildcard view, with continued policy uncertainty and wild swings in rate expectations. The diesel price spike adds to the risk of sticky inflation and a hawkish Fed, warranting close monitoring.
AI financing contributing to surging 10-year Treasury yields? Yes, we think so. We see at least four forces pushing long-term yields higher, including crowding out from AI debt issuance.
Reiterating our June view: higher for longer. All four forces are unlikely to reverse in the near term, keeping long-term yields higher for longer. We reiterate our June view that 4.5% represents the new floor for 10-year yields while the top of the range remains difficult to gauge.
Europe: the next pressure point? Surging sovereign yields and mounting fiscal strains, particularly in France, reinforce our higher-for-longer view outside the US. Stress could worsen before policymakers respond, but it is too early to call another euro debt crisis.
Call to Action. We maintain our Core Recommendation on short-duration (< 3 years), top-rated (A and above), investment-grade bonds. We suggest investors avoid aggressively adding duration until a clearer trading range for long-term yields is established.
Commodities
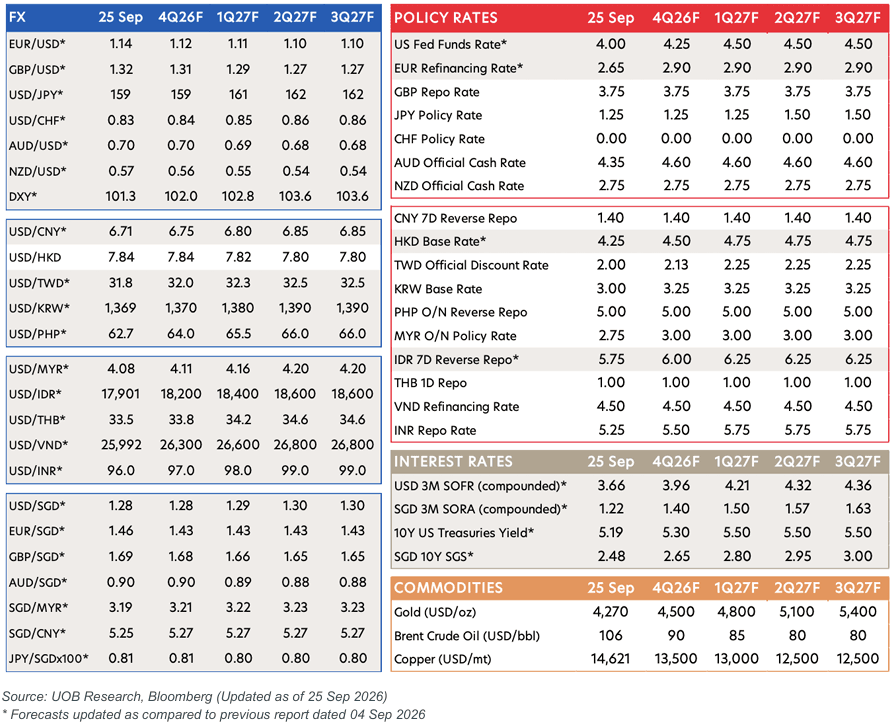
For currency views, we defer to our associate UOB. Below are their latest insights from the Monthly FX Rates Strategy (September 25, 2026). Please refer to Appendix D for UOB’s official forecasts on FX, interest rates and commodities. The full selection of UOB research is also available on its research portal.
The Sep FOMC rate hike represents a material change from the previous framework as outlined in our previous 4Q26 Quarterly FX Report dated 4 Sep. This warrants a reassessment of our medium-term bearish USD outlook. The Fed hike signals the start of a renewed US tightening cycle — a development that was not in our base case. Our macroeconomic team now projects two additional 25bp hikes, in Dec 2026 and 1Q27, with the Fed on hold thereafter through the remainder of 2027. This front-loaded tightening trajectory is expected to catalyze a meaningful recovery in US rate differentials relative to G10 peers.
As such, we revise our near to medium-term USD view from bearish to constructive. We now shift to an upward trajectory for the DXY, with USD gains frontloaded to the immediate two quarters as the Fed delivers the projected rate hikes. The updated DXY forecasts are 102.0 in 4Q26, 102.8 in 1Q27, and 103.6 in 2Q27 and 3Q27.
Asia FX has demonstrated notable resilience over the past two years, weathering significant headwinds including elevated trade tariffs of 2025 and the Middle East conflict across 2026. However, the resumption of a US tightening cycle introduces a qualitatively different challenge — one that strikes at the heart of rate differential and capital flow dynamics that have underpinned regional currency stability.
We now believe in a more defensively positioned Asia FX stance. That said, the sharply bifurcated year-to-date performance across Asia FX is likely to persist. Currencies with stronger fundamental buffers — current account surpluses, lower external financing needs, or greater monetary policy flexibility — may prove more resilient to renewed USD strength, and we continue to differentiate accordingly. Specifically, CNY and SGD are now expected to weaken modestly to 6.85 and 1.30 against the USD by 2Q27.
As for USD rates, consistent with our revised outlook for new Fed hiking cycle, we forecast 3M compounded-in-arrears SOFR at 3.96% in 4Q26, 4.21% in 1Q27, 4.32% in 2Q27 and 4.36% in 3Q27. Concurrently, we raise our 10Y UST yield forecasts to 5.30% in 4Q26, and 5.50% from 1Q27 through 3Q27. In our view, 10Y Treasury yields are likely to remain elevated amid the resumption of the Fed's hiking cycle and persistently high energy prices. The 20 bps increase from 4Q26 to 1Q27 reflects the anticipated transmission of the Fed rate hikes, while yields are expected to remain around 5.50% thereafter, supported by structural fiscal challenges in the US.
For Singapore, given the broadening price pressures, our macroeconomic team's updated view is now for the MAS to tighten monetary policy further via another “very slight” slope steepening move (+25bps) at the Oct 2026 MPS, taking the S$NEER slope to 1.5% p.a. Accordingly, we forecast 3M compounded-in-arrears SORA at 1.40% in 4Q26, 1.50% in 1Q27, 1.57% in 2Q27, and 1.63% in 3Q27. These forecasts represent an upward revision of 5-15 bps relative to our projections published on 4 Sep, reflecting the transmission of a higher US interest rate path and another “very slight” S$NEER slope steepening in Oct MPS.
Our forecasts continue to point to higher SGS yields over the projection horizon, driven by the gradual normalisation of Singapore-US interest rate differentials and the transmission of higher US rates. We now forecast the 10Y SGS yield at 2.65% in 4Q26, 2.80% in 1Q27, 2.95% in 2Q27, and 3.00% in 3Q27. These projections represent an upward revision of 25-50 bps relative to our previous forecasts and reflect our expectation that the Fed's renewed hiking cycle will continue to exert upward pressure on Singapore rates.
Appendix A: Our Top Five Predictions for 2026
Appendix B: Must Watch Events for Sep & Oct 2026
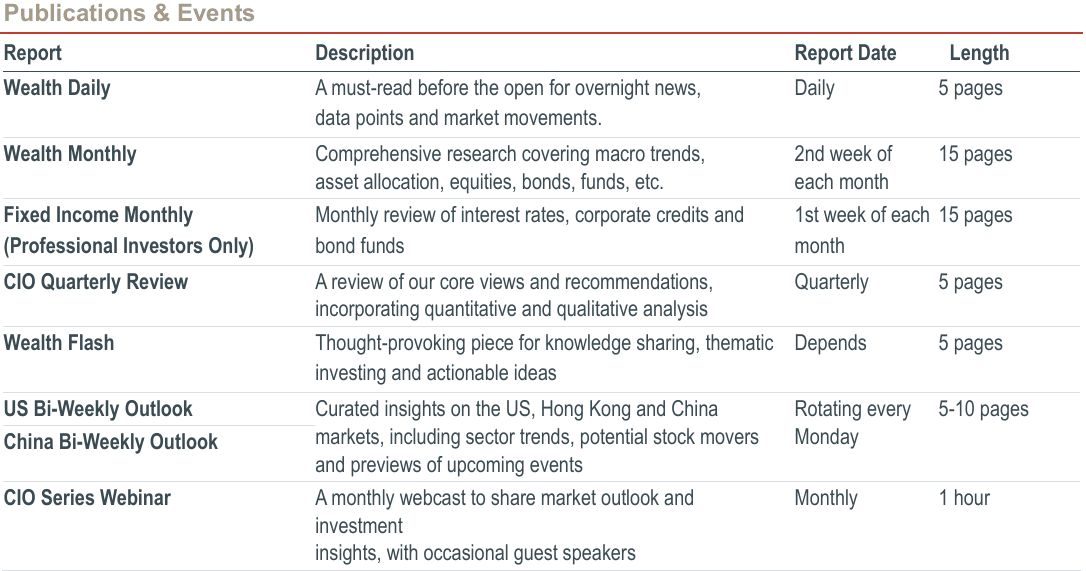
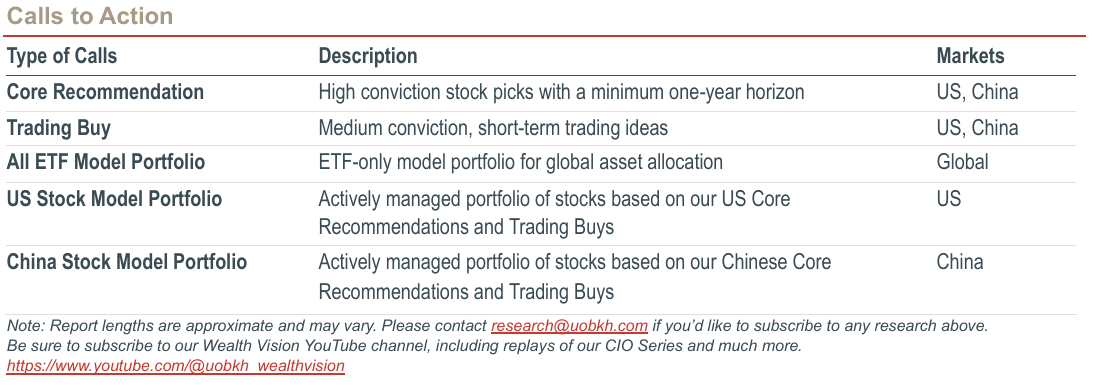
Appendix C: Roadmap to Private Wealth Management Research
Appendix D: UOB FX, Interest Rates & Commodities Forecasts
CIO Summary
Concentration everywhere. US equity performance remains highly dependent on Big Tech and AI, while 3Q earnings growth is similarly concentrated, putting the spotlight firmly on AI-related earnings and raising the stakes for AI leaders to deliver.
Sep-Oct market awakening intact. Macro headwinds add to the pressure on AI companies to perform, in order to sustain today’s narrow market leadership. We continue to believe a macro-driven, market awakening is in the works, although historically stocks tend to rally following the mid-term elections (November 3, 2026).
Meanwhile, the Fed Wildcard remains very much alive, with long-term yields turning “higher-for-longer” and adding pressure to rate-sensitive parts of the market. In China, persistent “Growing Pains” continue to weigh on the broader economy and equities despite strength in AI and exports. Against this increasingly uneven backdrop, we remain selective, favouring our Barbell Strategy of AI, defensives and energy, alongside short-duration, high-quality bonds.
Our All ETF Model Portfolio for global asset allocation lost 1.3% in September yet still gained 5.3% YTD. The Semiconductor Sector ETF (SOXX) and Nasdaq-100 (QQQ) were the largest contributors, while Industrials (XLI) and the CSI 300 ETF (3188.HK) were the biggest detractors.
Our US Stock Model Portfolio gained 1.3% in September and returned 10.2% YTD. Top 3 performers: META +26.8%, SKHY +11.9% and MU +11.1%.
Our China Stock Model Portfolio dropped 4.8% in September and lost 8.4% YTD. Top 3 performers: 2899.HK +10.2%, 883.HK +6.2% and 3986.HK +5.9%.
Fixed income: The Fed Wildcard is very much live, while long-term yields are turning “higher-for-longer”. Maintain our Core Recommendation on short-duration, high-quality corporate bonds.
Core Views and Recommendations
CIO Commentary
Our CIO Quarterly Review has been consistently one of our most-read reports, providing accountability for our core views and recommendations on a regular basis. Below are the key takeaways. Click here to read the full report.
Four of our top five predictions were validated through 3Q. China’s Growing Pains, the US China AI Race, Breaking the Dollar’s Grip (de-dollarization), and the Fed Wildcard were all reinforced by data and evidence in 3Q. The one miss was the Great AI Cooldown, as AI capex remained surprisingly strong in 2026.
Macro shocks vs. AI tailwinds. Our Core Views were broadly well-placed in 3Q, although we underestimated the resilience of global and US equities as robust earnings and continued AI optimism outweighed macro headwinds. Our fixed-income view proved correct, with the Fed Wildcard and higher-for-longer long-term Treasury yields supporting our Core Recommendation for high-quality, short-duration bonds. Meanwhile, gold’s resilience further validated our long-term bullish view, underpinned by its role as a top de-dollarization beneficiary and a key portfolio diversifier.
Key Call on oversold AI “casualties” continued to pay off, outperforming the Nasdaq 100 in 3Q and since our Feb 24 initiation. Microsoft, Broadcom and Snowflake remain our top picks here, backed by strong AI growth and adoption. AppLovin was removed after its August results raised company-specific concerns, but it remained on our watch list.
US Core Recommendations have broadly outperformed market in 3Q. Our AI stock picks outperformed both the S&P 500 and Nasdaq 100, while energy-related picks continued to beat the index by a wide margin. Defensives lagged during the market upturn, as expected, but remain essential portfolio stabilisers.
China Core Recommendations delivered mixed yet solid performance in 3Q. Our Greater China AI picks significantly outperformed the Hang Seng Tech Index, while energy-related stocks also maintained their YTD lead over the Hang Seng Index despite a weaker 3Q. Defensives lagged during the market rebound but remained ahead YTD. Almost everywhere, China’s Growing Pains continued to weigh on company fundamentals and investor sentiment.
We continue to recommend a balanced approach based on our barbell strategy, investing across AI, defensives and energy.
Asset Allocation (All ETF Model Portfolio)
- Our All ETF Portfolio for global asset allocation was down 1.3% in September yet still up 5.3% YTD. The Semiconductor Sector ETF (SOXX) and Nasdaq-100 (QQQ) were the top performers, +11.3% and +3.3%, respectively. Meanwhile, Industrials (XLI) and the CSI 300 ETF (3188.HK) were the biggest detractors, -4.4% and -4.9%, respectively.
- US Equities UNDERWEIGHT (30.5% vs. 36.6%). In September, we took profits in the Semiconductor Sector ETF (SOXX) following its strong rebound while redeploying the proceeds into S&P 500 (SPY) for broader market exposure.
- Developed Markets ex-US UNDERWEIGHT (10% vs. 16.6%). DM ex-US (IDEV) dropped 3.4% in September, driven mainly by weakness in Europe amid rising bond yields, sticky inflation and emerging sovereign risk (e.g. France). The decline was partly offset by gains in Japan. IDEV remained up 10.1% YTD.
- Emerging Markets ex-China UNDERWEIGHT (4.3% vs. 5.6%). EM ex-China (EMXC) rose slightly by 0.9% in September, supported by gains in Taiwan and South Korea. Despite global macro pressures, strong AI supply chain fundamentals helped EMXC gain 37.1% YTD, making it one of the best performing regions globally. (Top constituents: TSMC 20%, Samsung 8%, Hynix 6%).
- China Equities OVERWEIGHT (5.8% vs. 2.2%). We reduced our position in the Hang Seng Index ETF (2800.HK) last month amid continued “growing pains” in China and rising US interest rates. We do not expect an immediate recovery in either the Chinese economy or stock markets.
- Fixed Income EQUAL-WEIGHT (38.8% vs. 39.0%). Our bond ETFs declined 1.8% in September as 10-year Treasury yields surged past 5% to multi-decade highs. The Intermediate-term Corporate Bond ETF (VCIT) fell 3.0% last month and lost 3.4% YTD, while the Short-term Corporate Bond ETF (VCSH) declined 1.2% in September yet gained 0.2% YTD. This performance disparity further validates our Core Recommendation to stay short-duration in today’s uncertain rate environment (see the Fixed Income section below).
- Gold OVERWEIGHT (4.6% vs. 0.0%). Gold (2840.HK) declined 6.3% in September, following a near 10% rally in August. Despite high volatility YTD, we continue to view gold as a valuable long-term hedge against geopolitical risks, currency volatility and de-dollarisation.
Equities
US Equities
Is our Sep-Oct market awakening happening? Perhaps not at the index level, but September was not an easy month for most US stocks. The index’s modest decline masked high concentration risk beneath the surface, with an equally concentrated 3Q earnings season now upon us. With the US mid term elections less than three weeks away, political uncertainty could add another layer of short-term volatility. The VIX has quietly climbed back above 17 as of mid-October, suggesting investor fear is building. We continue to believe a macro-driven market awakening is in the works, although historically stocks tend to rally after the mid-terms (November 3, 2026).
The Fed Wildcard on full display. Our top prediction for 2026 hit squarely, as the Fed raised rates by 25bps in September – its first hike in over three years. The FOMC’s unanimous 12–0 vote in favor of tightening underscores a clear determination to restore Fed credibility amid persistent inflation.
Higher long-term rates also begin to bite. The melt-up in global bond yields has helped push 10 year Treasury yields above 5.3% in early October, reflecting sticky inflation, resilient growth, a more hawkish Fed outlook and the mounting US debt burden etc. Higher long-term yields pose a material risk to rate-sensitive, cyclical sectors (e.g. real estate and mining) and financially fragile small caps (around 40% of Russell 2000 are unprofitable), as the rising cost of capital weighs heavily on their borrowing costs and valuation multiples.
Equities surprisingly calm. However, the stock market’s response has been relatively measured: the S&P 500 was down only slightly for the month and tentatively broke above the ~7700 congestion zone, pushing its YTD return to 13.1% by the end of September.
Extreme market concentration. While the headline S&P 500 sits close to all-time highs, the median S&P stock trades at 16% below its respective peak. This stark divergence has pushed market breadth to its lowest level since the Dot-Com Bubble. On one hand, US Big Tech and AI stocks continue to power ahead like a freight train. On the other hand, nearly half of the index names have exhibited negative beta to the index. Such concentration risk leaves the market increasingly vulnerable to a sudden change in sentiment.
Extreme earnings concentration. The 3Q earnings season kicks off this week, with roughly two thirds of S&P 500 companies reporting by October-end. Good news: consensus expects nearly 30% earnings growth for S&P 500 in 3Q, marking the third consecutive quarter of growth above 25%. Not so good news: Two companies, Nvidia and Micron, are expected to drive 36% of S&P earnings growth in 3Q (source: Citadel). In other words, the market’s extreme concentration (see above) is mirrored in earnings and can be justified by fundamentals. However, this has certainly raised the stakes for AI to deliver.
Source: UOB Kay Hian and Bloomberg. As of September 30, 2026.
Our US Stock Model Portfolio gained 1.3% in September and returned 10.2% YTD, outperforming S&P 500 (SPY) last month yet still underperforming the index YTD. The September alpha was driven by Information Technology (SKHY +11.9%, MU +11.1%, LITE +6.2%, NVDA +3.6%, SNOW +2.5%, GOOGL +1.5%, MSFT +1.1%) and Communication Services (META +26.8%). This was partly offset by losses in Energy (OXY -7.7%, XLE -3.3%), Consumer Discretionary (AMZN 4.1%), Health Care (JNJ -0.4%, XLV -0.9%), Consumer Staples (WMT -0.9%), and Industrials (XLI -4.4%).
Cash rose to 26.6% at September-end, as we sold stocks to prepare for the Sep-Oct market awakening.
Top 3 performers: META +26.8%, SKHY +11.9% and MU +11.1%.
Bottom 3 performers: OXY -7.7%, AVGO -5.0% and XLI -4.4%.
For company updates, please refer to our latest CIO Quarterly Review.
Must watch events for the rest of October: US Sep PPI and Retail Sales (Oct 15), Chair Warsh’s Speech at the IMF Annual Meeting (Oct 16), October FOMC Rate Decision (Oct 27–28), and US 3Q GDP and PCE (Oct 29). Earnings: ASML (Oct 14), TSMC (Oct 15), NFLX (Oct 20), TSLA (Oct 21), KO (Oct 27), GOOGL, META, MSFT, and SKHY (Oct 29), and AAPL and AMZN (Oct 30). For more information, please see Appendix B.
China Equities
September was a difficult month for Hong Kong-China equities. The Hang Seng Index fell 3.7%, while the CSI 300 declined 5.8%, weighted down by weak domestic fundamentals, limited policy stimulus and rising US interest rates.
China’s Growing Pains remain intact and unresolved. August industrial production rose 5.2% yoy, ahead of consensus, but retail sales increased just 0.4%. Jan-Aug fixed-asset investment fell 7.2%, including a 19.9% decline in property investment, while household loans contracted for a second consecutive month. September property data remained weak, with sales among the top 100 developers falling 9.2% yoy.
Exports remain a notable bright spot. September exports surged 36.3% yoy, well above consensus, led by semiconductors (+136%) and autos (+62%). This highlights the growing divergence between China's globally competitive export sectors and struggling domestic demand. The data also reinforce our China Export Shock 2.0 theme, which has profound implications for both the Chinese economy and global manufacturing industries.
Hong Kong faces an additional headwind from rising US interest rates. The Fed's renewed tightening and rising long-term Treasury yields have added economic and financial pressures on Hong Kong, given HKD's peg to the USD. This was evident during September, when Hong Kong underperformed mainland A-shares and the Hang Seng Tech Index came under renewed pressure.
We remain cautious on China, as we do not expect an immediate recovery in either the Chinese economy or equity markets. A broad-based market recovery will likely require clearer evidence of improving property sales, consumption and investment, rather than just a booming AI sector or simply more policy announcements. Key upcoming catalysts include China's 3Q GDP and September activity data on Oct 19, the LPR announcement on Oct 20, and Top 100 property sales on Oct 31.
Selectivity is key. A sluggish market (beta) is not necessarily bad for stock picking (alpha). In fact, cyclical weakness, uneven fundamentals and low valuations (expectations) can create attractive entry points in high-quality companies whose long-term investment theses remain intact. September's sell-off has further weakened investor sentiment, but it does not change our high conviction in our Chinese Core Recommendations.
Where we see opportunities. Regardless of the macro environment, we continue to focus on our Barbell Strategy consisting of AI, defensives and energy (applicable to both the US and China). In AI, we like full-stack leaders such as Tencent and Alibaba, where strong cash-generating core businesses support long-term AI investment and monetisation. Meanwhile, we also favour defensives for their earnings stability and compelling dividend yields, including PetroChina which also offers oil price exposure.
Our China Stock Model Portfolio dropped 4.8% in September, slightly underperforming the MSCI China ETF (MCHI -4.5%). The portfolio was down 8.4% YTD, still significantly outperforming MCHI’s 11.8% decline.
Cash slightly increased to 19.3% at month-end, compared with 18.3% in August.
Top 3 performers: TSM +10.2%, 1288.HK +4.5% and 1398.HK +1.8%.
Bottom 3 performers: 300750.SZ -19.7%, 175.HK -17.3% and 9961.HK -14.2%.
For company updates, please refer to our latest CIO Quarterly Review.
Must-watch events for the rest of October include China's 3Q GDP, September retail sales, industrial production, fixed-asset investment and unemployment – all on Oct 19; Loan Prime Rate (LPR) announcement on Oct 20; the Fifth Plenum in Oct 26-29; September industrial profits in late October; October NBS PMI and Top 100 property developer sales on Oct 31. Earnings: CATL (Oct 20) and HSBC (Oct 27).
Fixed Income
Below is the CIO Summary from our latest Fixed Income Monthly (12 Oct 2026), for Professional / Accredited Investors only. Ping benjamintan@uobkh.com if you’d like to receive the full report.
Fed Wildcard in full play. September’s sharp repricing of Fed expectations reinforces our Fed Wildcard view, with continued policy uncertainty and wild swings in rate expectations. The diesel price spike adds to the risk of sticky inflation and a hawkish Fed, warranting close monitoring.
AI financing contributing to surging 10-year Treasury yields? Yes, we think so. We see at least four forces pushing long-term yields higher, including crowding out from AI debt issuance.
Reiterating our June view: higher for longer. All four forces are unlikely to reverse in the near term, keeping long-term yields higher for longer. We reiterate our June view that 4.5% represents the new floor for 10-year yields while the top of the range remains difficult to gauge.
Europe: the next pressure point? Surging sovereign yields and mounting fiscal strains, particularly in France, reinforce our higher-for-longer view outside the US. Stress could worsen before policymakers respond, but it is too early to call another euro debt crisis.
Call to Action. We maintain our Core Recommendation on short-duration (< 3 years), top-rated (A and above), investment-grade bonds. We suggest investors avoid aggressively adding duration until a clearer trading range for long-term yields is established.
Commodities
For currency views, we defer to our associate UOB. Below are their latest insights from the Monthly FX Rates Strategy (September 25, 2026). Please refer to Appendix D for UOB’s official forecasts on FX, interest rates and commodities. The full selection of UOB research is also available on its research portal.
The Sep FOMC rate hike represents a material change from the previous framework as outlined in our previous 4Q26 Quarterly FX Report dated 4 Sep. This warrants a reassessment of our medium-term bearish USD outlook. The Fed hike signals the start of a renewed US tightening cycle — a development that was not in our base case. Our macroeconomic team now projects two additional 25bp hikes, in Dec 2026 and 1Q27, with the Fed on hold thereafter through the remainder of 2027. This front-loaded tightening trajectory is expected to catalyze a meaningful recovery in US rate differentials relative to G10 peers.
As such, we revise our near to medium-term USD view from bearish to constructive. We now shift to an upward trajectory for the DXY, with USD gains frontloaded to the immediate two quarters as the Fed delivers the projected rate hikes. The updated DXY forecasts are 102.0 in 4Q26, 102.8 in 1Q27, and 103.6 in 2Q27 and 3Q27.
Asia FX has demonstrated notable resilience over the past two years, weathering significant headwinds including elevated trade tariffs of 2025 and the Middle East conflict across 2026. However, the resumption of a US tightening cycle introduces a qualitatively different challenge — one that strikes at the heart of rate differential and capital flow dynamics that have underpinned regional currency stability.
We now believe in a more defensively positioned Asia FX stance. That said, the sharply bifurcated year-to-date performance across Asia FX is likely to persist. Currencies with stronger fundamental buffers — current account surpluses, lower external financing needs, or greater monetary policy flexibility — may prove more resilient to renewed USD strength, and we continue to differentiate accordingly. Specifically, CNY and SGD are now expected to weaken modestly to 6.85 and 1.30 against the USD by 2Q27.
As for USD rates, consistent with our revised outlook for new Fed hiking cycle, we forecast 3M compounded-in-arrears SOFR at 3.96% in 4Q26, 4.21% in 1Q27, 4.32% in 2Q27 and 4.36% in 3Q27. Concurrently, we raise our 10Y UST yield forecasts to 5.30% in 4Q26, and 5.50% from 1Q27 through 3Q27. In our view, 10Y Treasury yields are likely to remain elevated amid the resumption of the Fed's hiking cycle and persistently high energy prices. The 20 bps increase from 4Q26 to 1Q27 reflects the anticipated transmission of the Fed rate hikes, while yields are expected to remain around 5.50% thereafter, supported by structural fiscal challenges in the US.
For Singapore, given the broadening price pressures, our macroeconomic team's updated view is now for the MAS to tighten monetary policy further via another “very slight” slope steepening move (+25bps) at the Oct 2026 MPS, taking the S$NEER slope to 1.5% p.a. Accordingly, we forecast 3M compounded-in-arrears SORA at 1.40% in 4Q26, 1.50% in 1Q27, 1.57% in 2Q27, and 1.63% in 3Q27. These forecasts represent an upward revision of 5-15 bps relative to our projections published on 4 Sep, reflecting the transmission of a higher US interest rate path and another “very slight” S$NEER slope steepening in Oct MPS.
Our forecasts continue to point to higher SGS yields over the projection horizon, driven by the gradual normalisation of Singapore-US interest rate differentials and the transmission of higher US rates. We now forecast the 10Y SGS yield at 2.65% in 4Q26, 2.80% in 1Q27, 2.95% in 2Q27, and 3.00% in 3Q27. These projections represent an upward revision of 25-50 bps relative to our previous forecasts and reflect our expectation that the Fed's renewed hiking cycle will continue to exert upward pressure on Singapore rates.
Appendix A: Our Top Five Predictions for 2026
Appendix B: Must Watch Events for Sep & Oct 2026
Appendix C: Roadmap to Private Wealth Management Research
Appendix D: UOB FX, Interest Rates & Commodities Forecasts
Disclosures and disclaimers
This report is provided subject to, and must be read together with, the full Disclosures / Disclaimers available at this link, which are incorporated by reference into this report. In particular, this report is intended for general circulation and informational purposes only and does not constitute personal investment advice or a recommendation to buy or sell any investment product or security. You should independently evaluate the information and, where necessary, seek advice from a qualified financial adviser regarding the suitability of any investment. Analyst certifications required under applicable regulations, including SEC Regulation AC (where relevant), are included in this report. By accessing, receiving or using this report, you acknowledge that you have read, understood and agreed to be bound by the Disclosures / Disclaimers, as may be amended, supplemented or updated from time to time.


